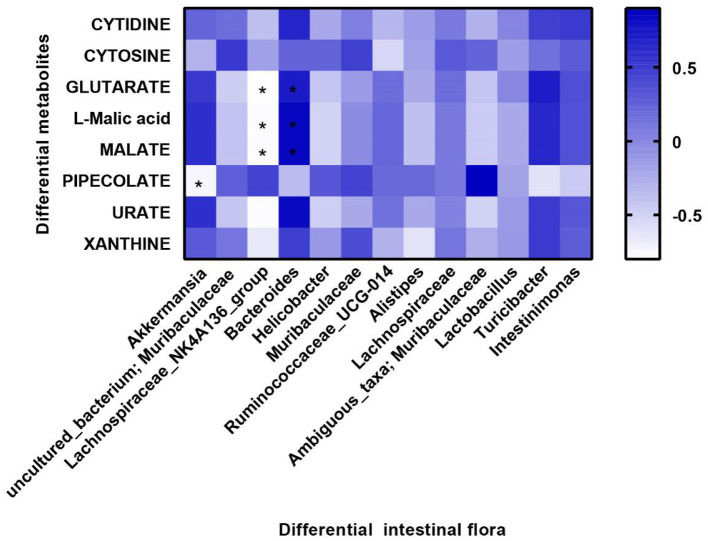
Figure 6.
Correlation between microbial diversity and metabolites. Differential metabolites are displayed on the y-axis, and differential flora are displayed on the x-axis. Blue color represents positive correlation, and white color represents negative correlation. Spearman analysis was used to compare all groups. *P < 0.05 differential metabolites vs. differential intestinal flora.

