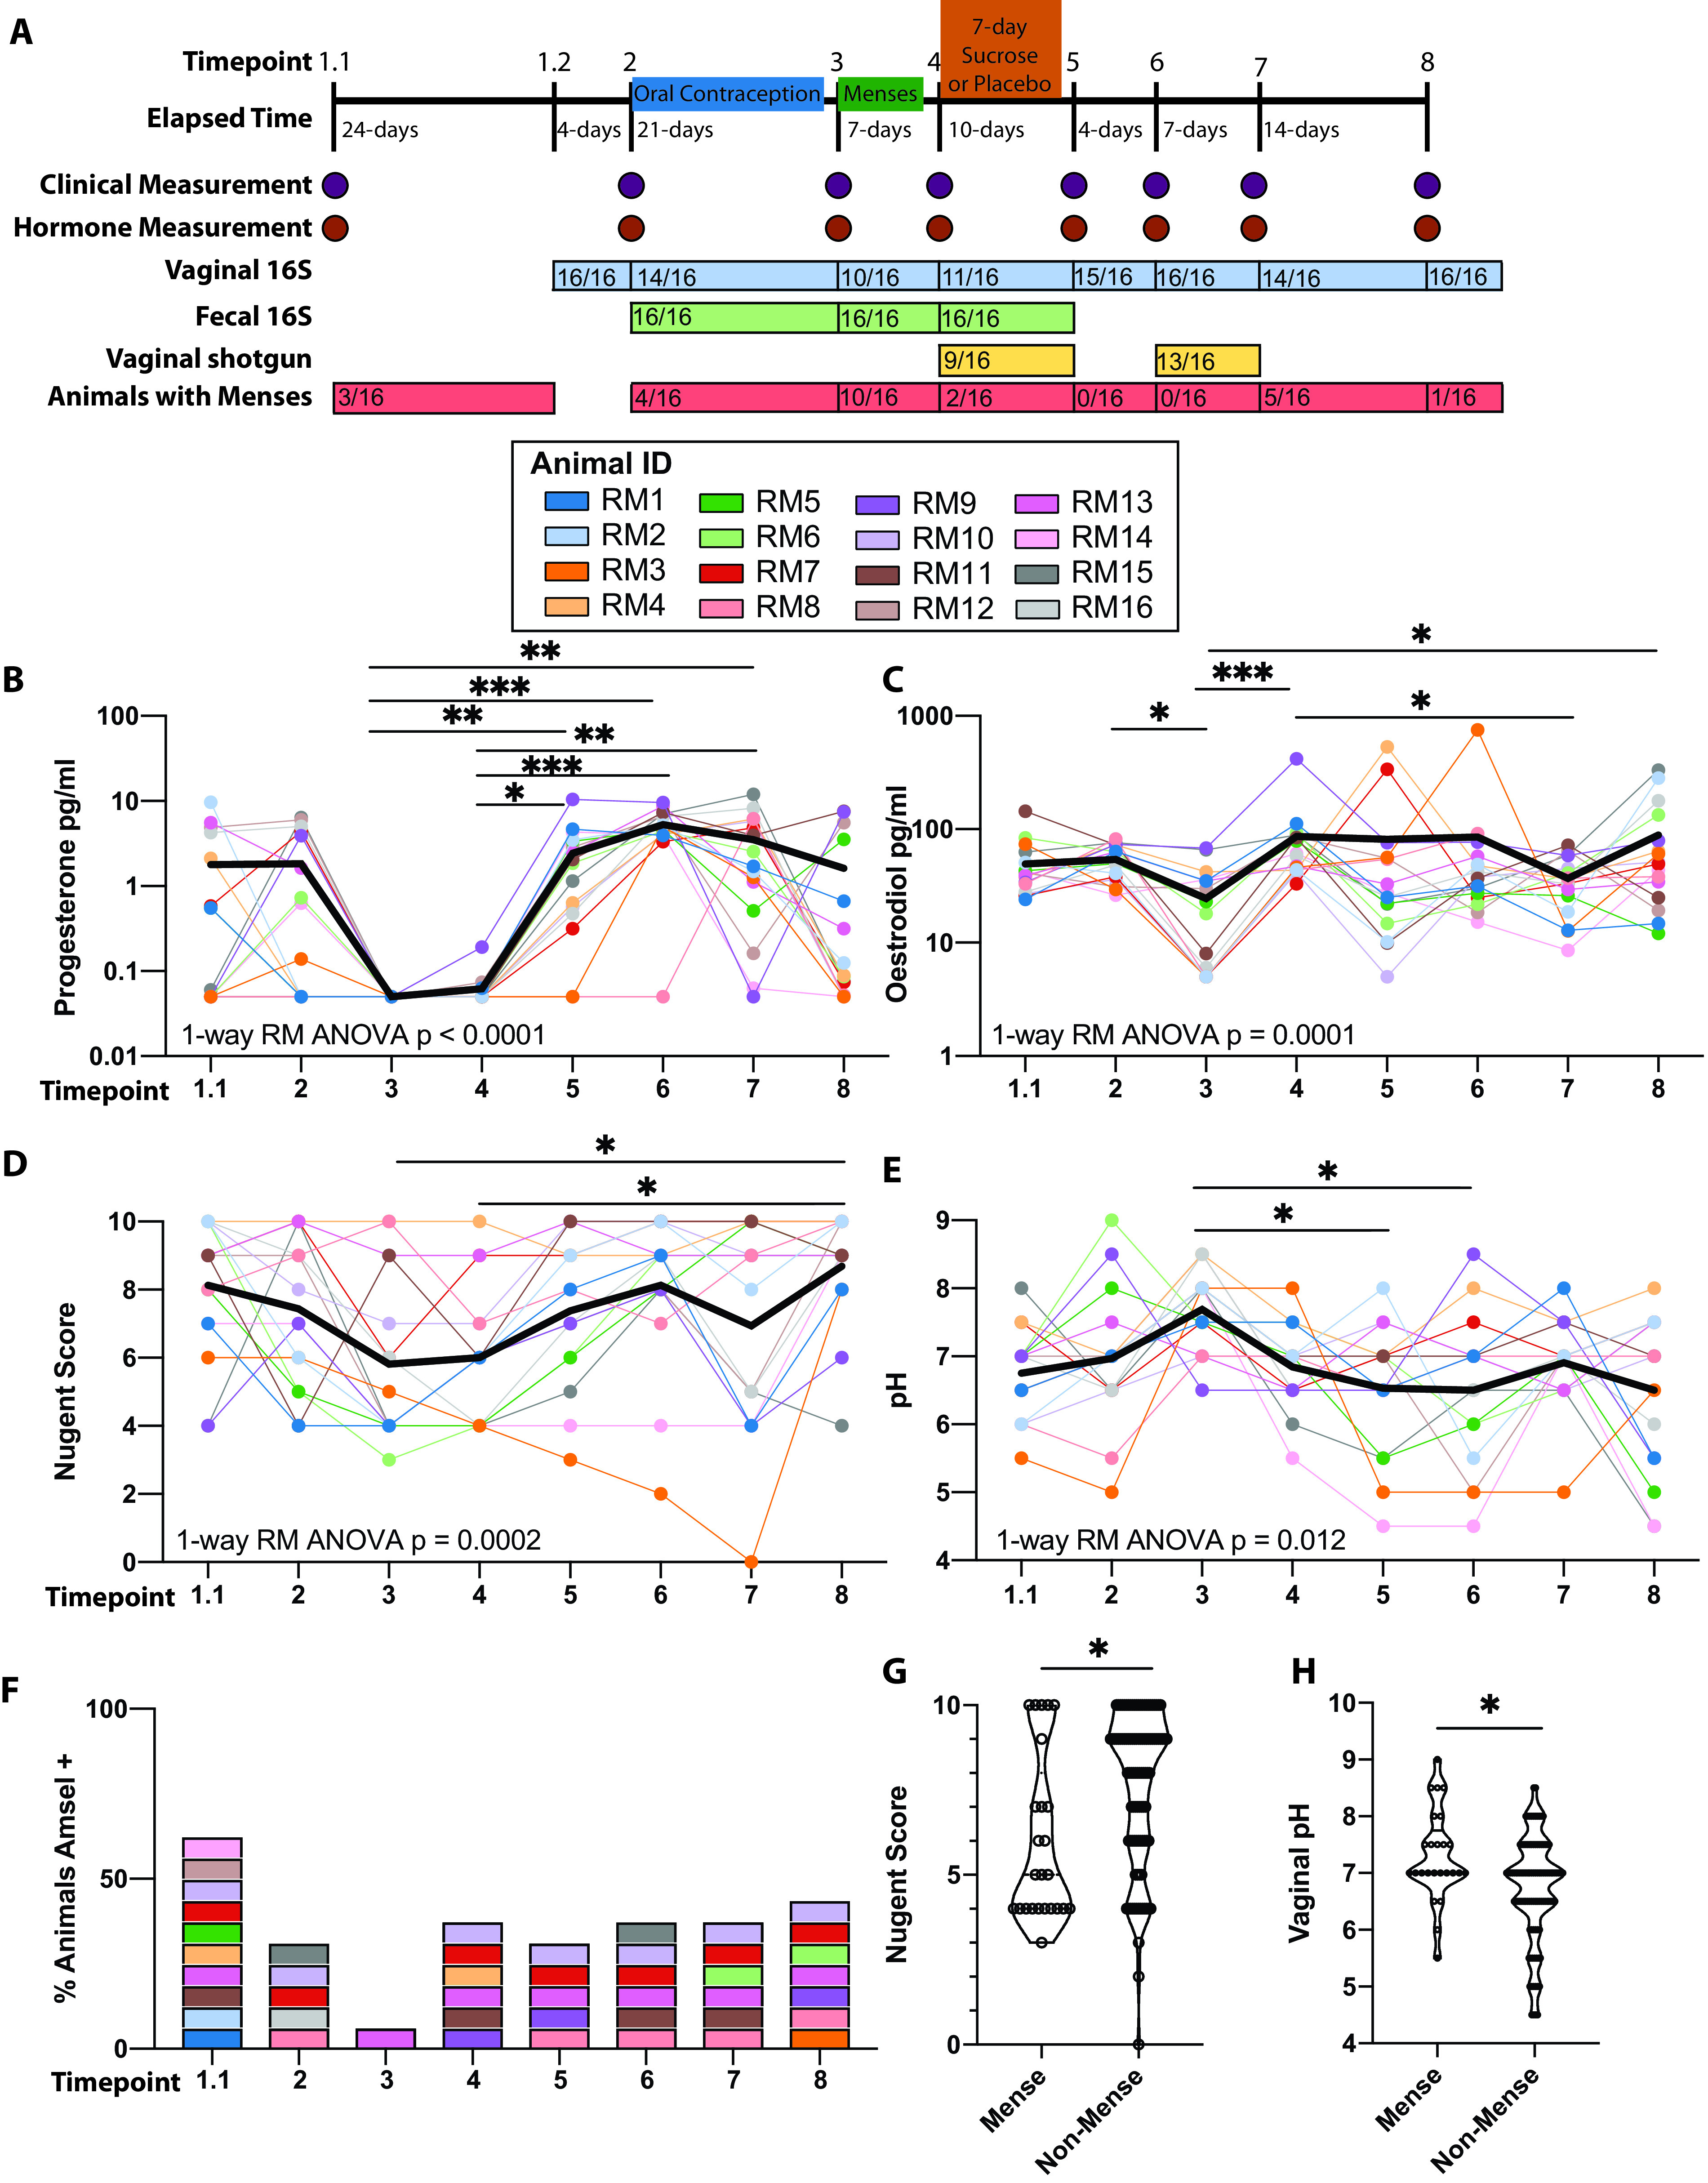
FIG 1.

Longitudinal assessment of clinical markers associated with BV. (A) Study design and timeline. (B to E) Scatterplot of measured systemic (B) progesterone, (C) estradiol, (D) Nugent scores, and (E) pH. Each dot represents an individual sample, with solid lines connecting samples from the same individual across time. The bold black line represents the mean value across time. Significance was measured by nonparametric one-way repeated-measure ANOVA (Friedman test) with Dunn's post hoc comparisons between time points. The overall P value is denoted on each graph, and bars denote significance of post hoc tests: *, P < 0.05; **, P < 0.01; and ***, P < 0.001. (F) Stacked bar graph denoting the percentage of animals that meet Amsel criteria. Colors correspond to those used in panels B to E. (G and H) Scatterplot of (G) Nugent scores and (H) vaginal pH comparing samples collected in animals with and without menses. Significance was determined by nested t test within an individual: *, P < 0.05.
