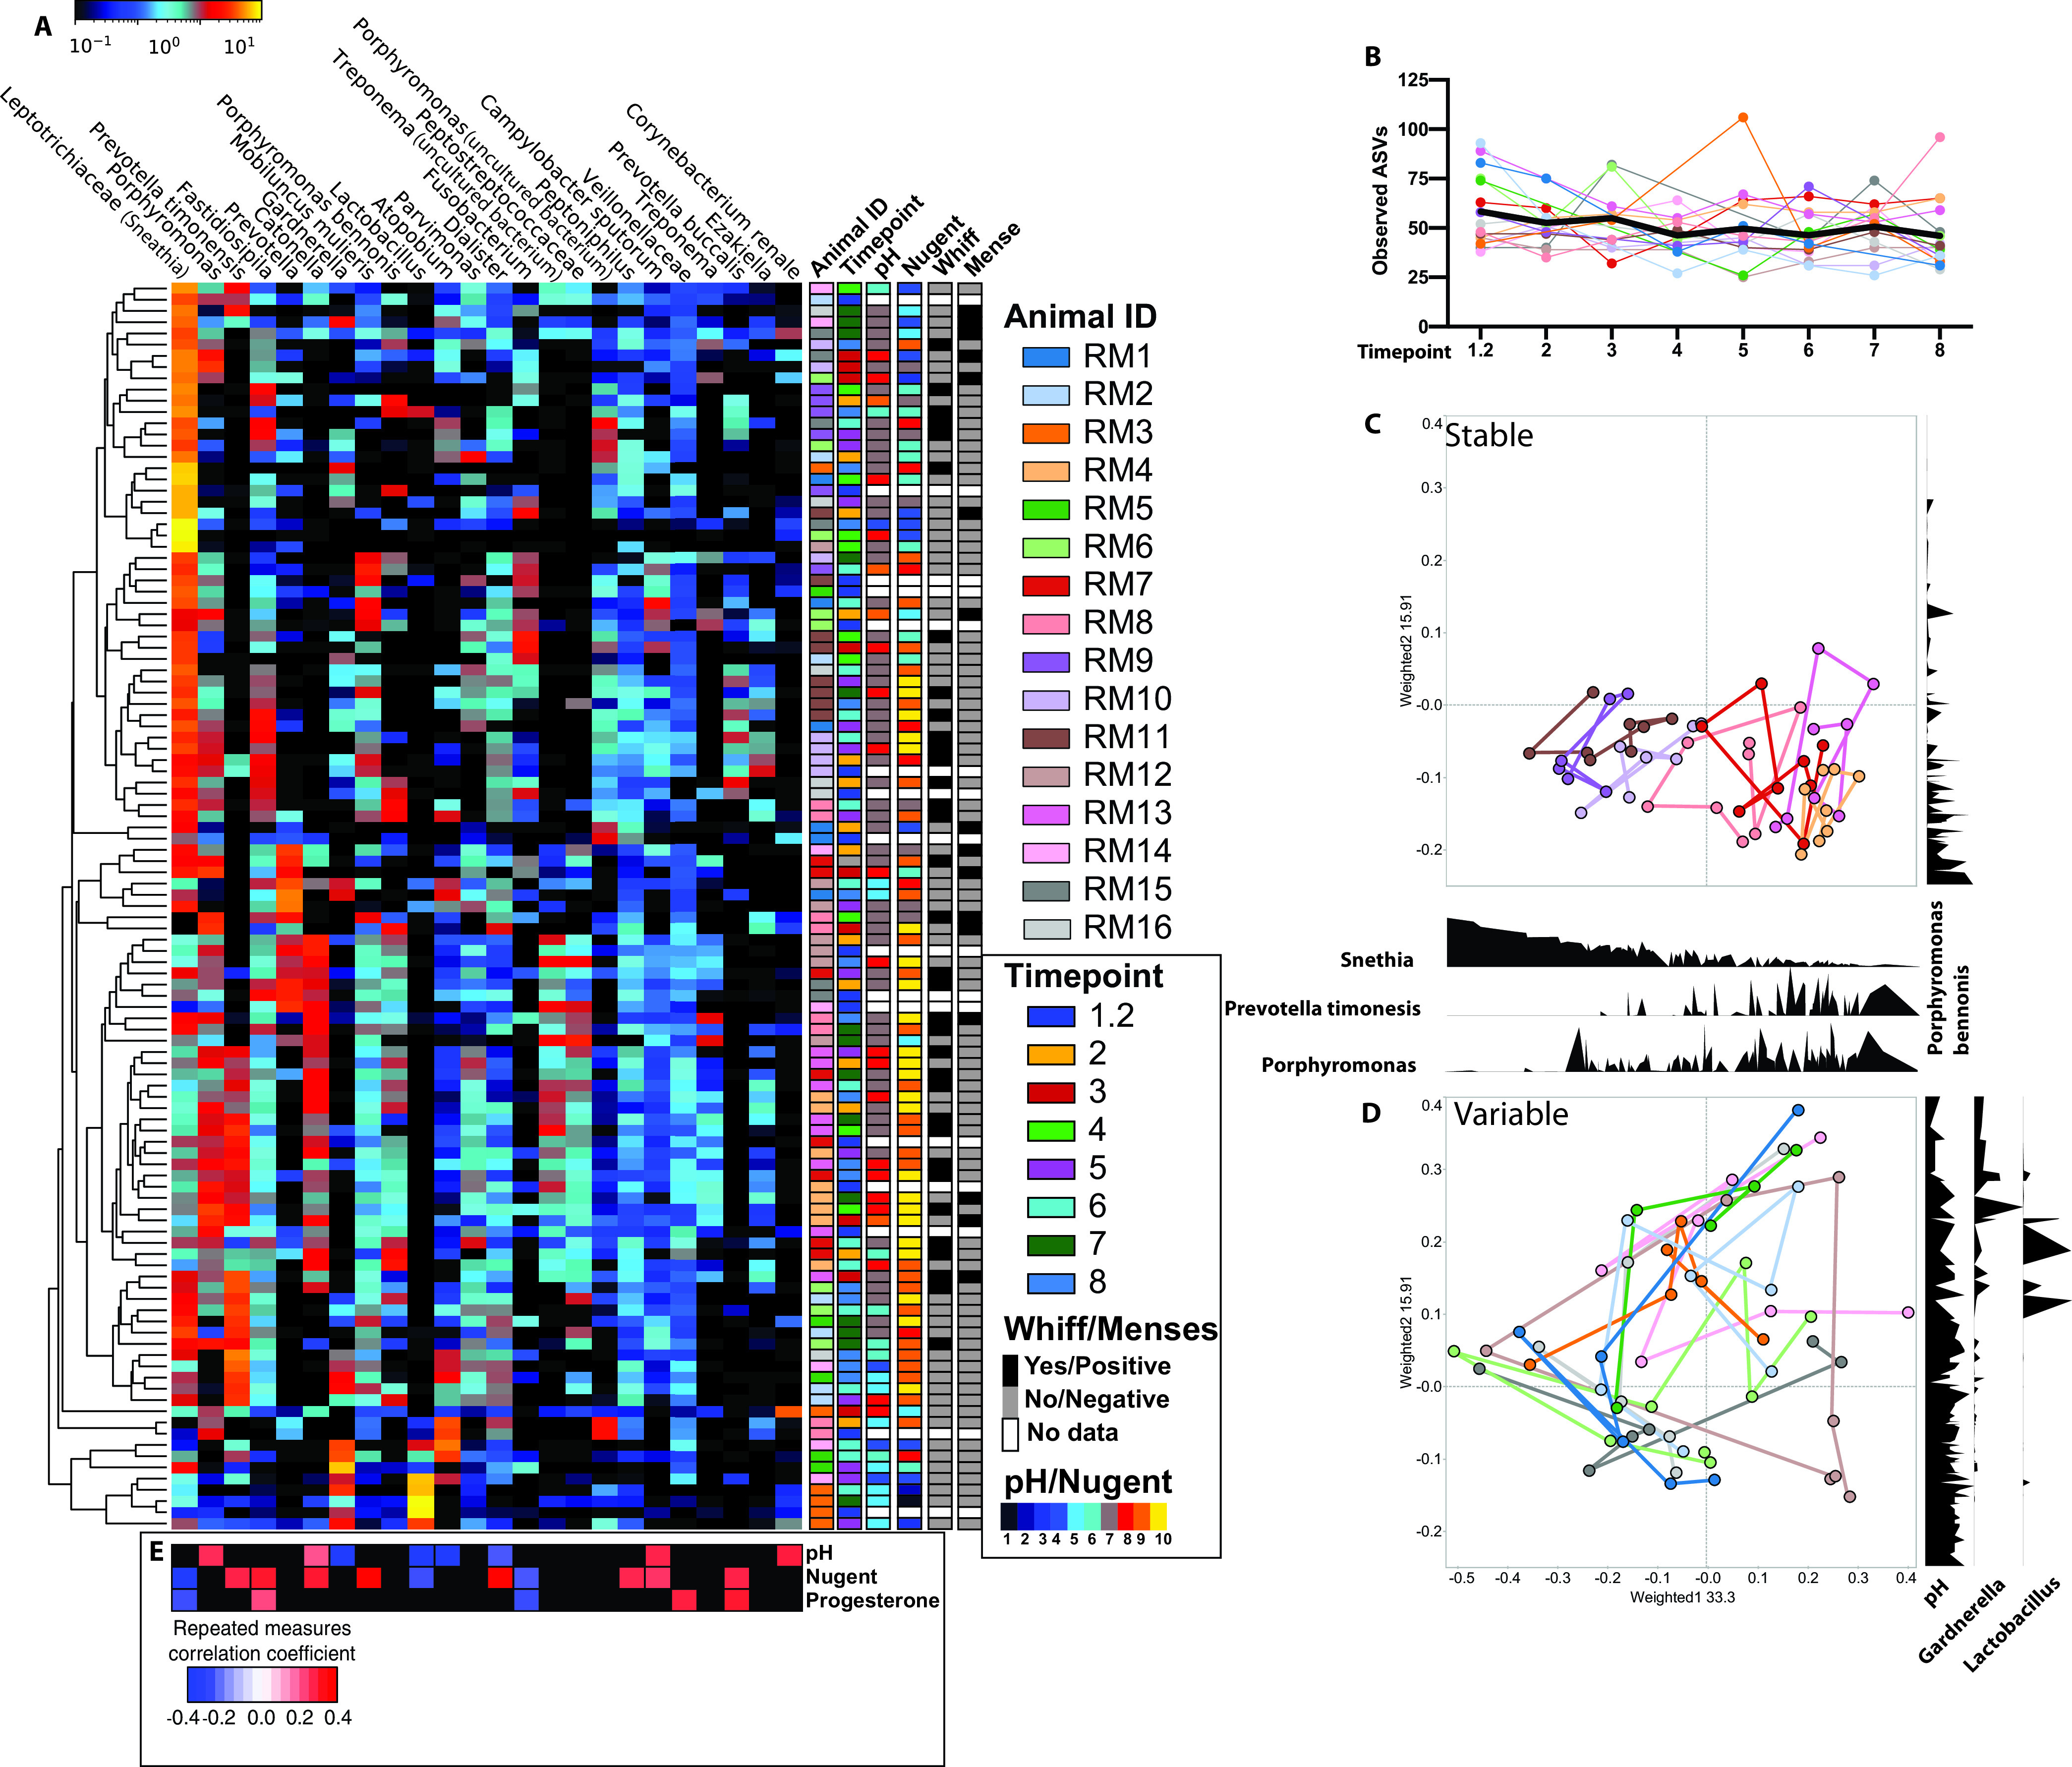
FIG 2.

Longitudinal changes in the rhesus macaque vaginal microbiome. (A) Heat map of the 25 most abundant taxa across all samples ordered from left to right by average abundance. Samples clustered by average linkage of Bray-Curtis distance between samples, as illustrated by the vertical tree. Shown are metadata associated with each sample, including animal ID, time point, Nugent score, vaginal pH, whiff test positivity, and menstruation status. (B) Scatterplot of absolute sequence variants (ASVs) at each time point. Each dot represents an individual sample, with solid lines connecting samples from the same individual across time. The bold black line represents the mean value across time. (C and D) Principal-coordinate analysis of weighted UniFrac distance colored by individuals with lines connecting samples collected from the same individual over time, with density plots of key microbial taxa along the PCoA1 and PCoA2 axis. (E) Heat map of repeated-measure correlation values between vaginal pH, Nugent scores, and systemic progesterone levels against the relative abundance of the top 25 microbes. Significant (P < 0.05) positive correlations are shaded in red, negative in blue, and nonsignificant (P > 0.05) in black.
