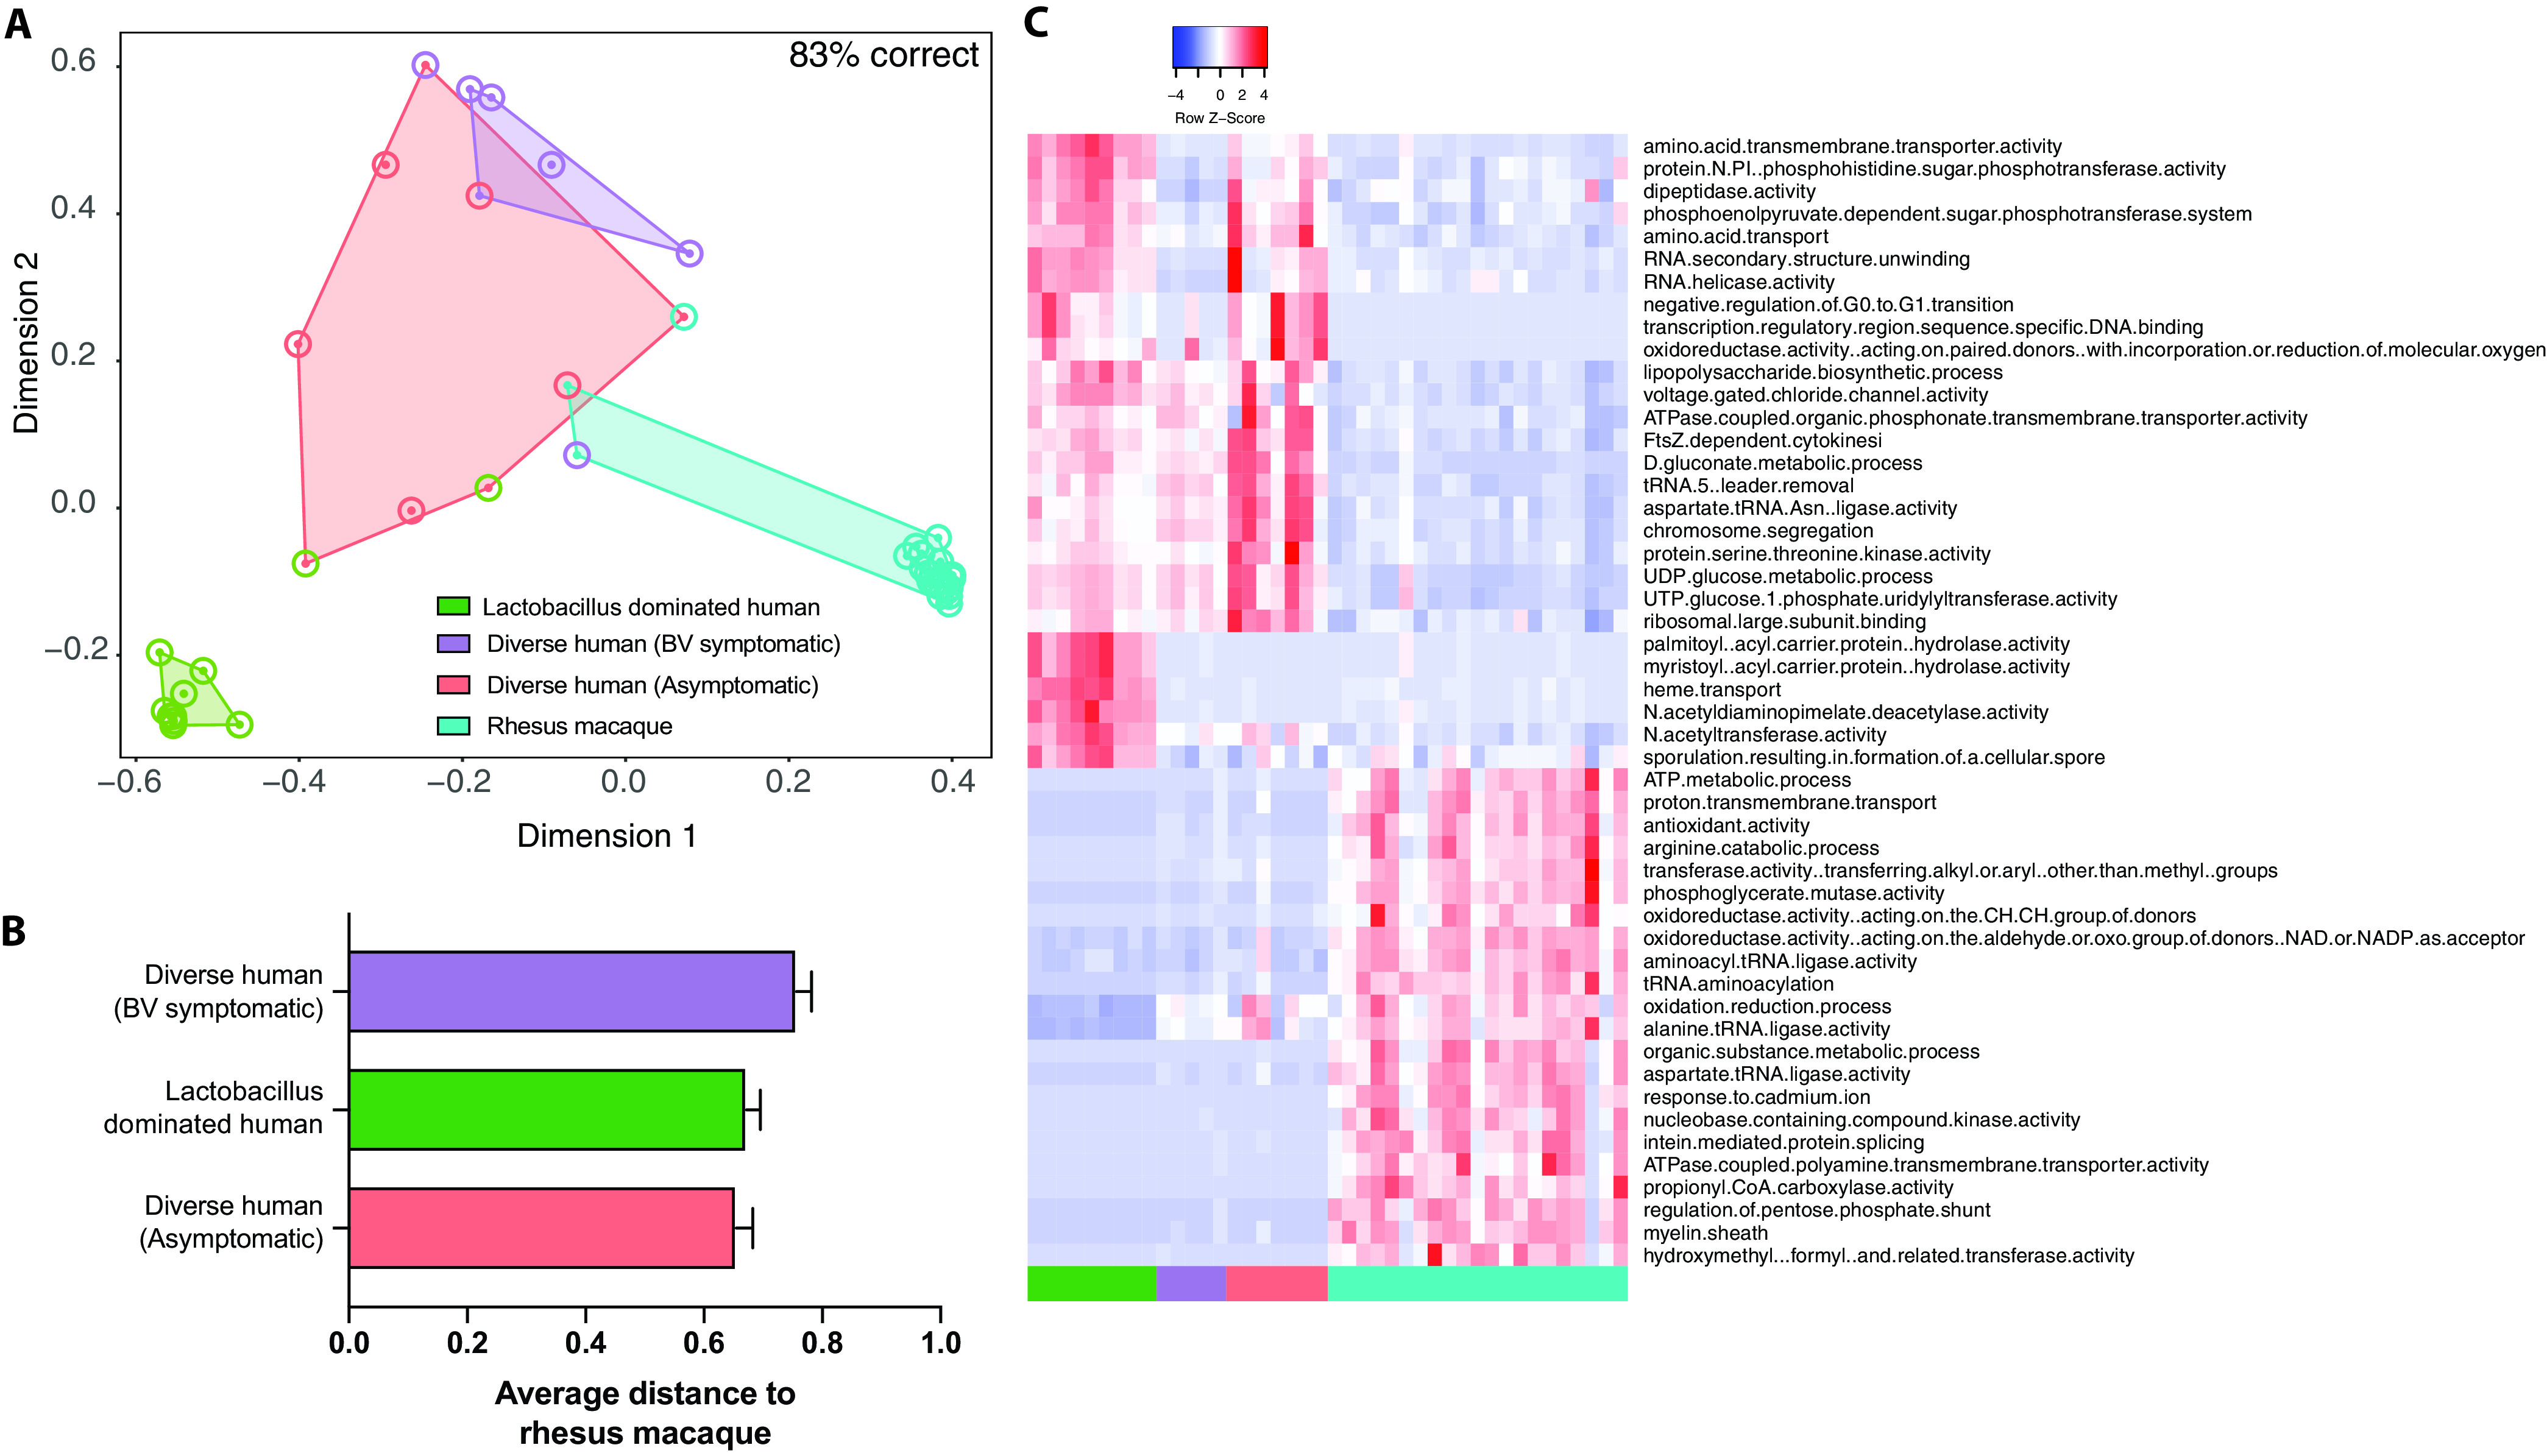
FIG 5.

Comparison of the functional potentials of the rhesus and human vaginal microbiomes. (A) NMDS plot colored by sample source. Outer circles denote if a sample was misclassified at any point during the random forest model generation. The color of the outer circle represents which group that sample was misclassified as. (B) Bar graph of the average random forest proximity between the rhesus macaque vaginal microbiome and the three human communities. (C) Heat map of the 50 most important GO terms as predicted by random forest modeling.
