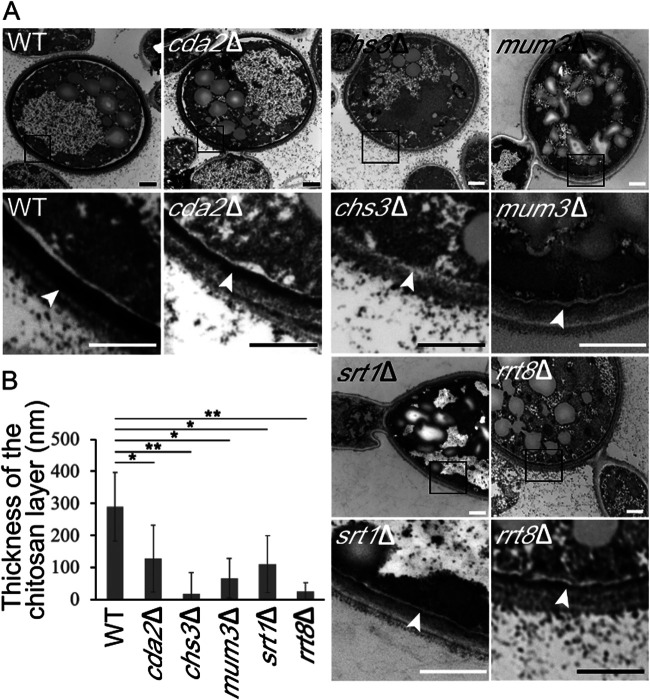
FIG 6.
Electron microscopy of the chlamydospore wall of C. dubliniensis. (A) Chlamydospores were induced, and cells of different strains were stained with osmium-thiocarbohydrazide: WT (CD1465), cda2Δ (BEM7), chs3Δ (BEM8), mum3Δ (BEM11), srt1Δ (BEM14), and rrt8Δ (BEM13). For each strain, a pair of images is shown. The lower image is a higher magnification of the boxed region in upper image. Arrowheads indicate the inner cell wall layer. (B) Quantification of the thickness of the chitosan layer in each strain. Data represented are the means of measurements from 20 chlamydospores. The thickness of the chitosan layer was measured at 5 different positions on each chlamydospore. Error bars indicate one standard deviation. One asterisk (*) indicates a significant difference at P < 0.00005; two asterisks (**) in indicates P < 5E–10 (Student t test). Scale bar, 500 nm.

