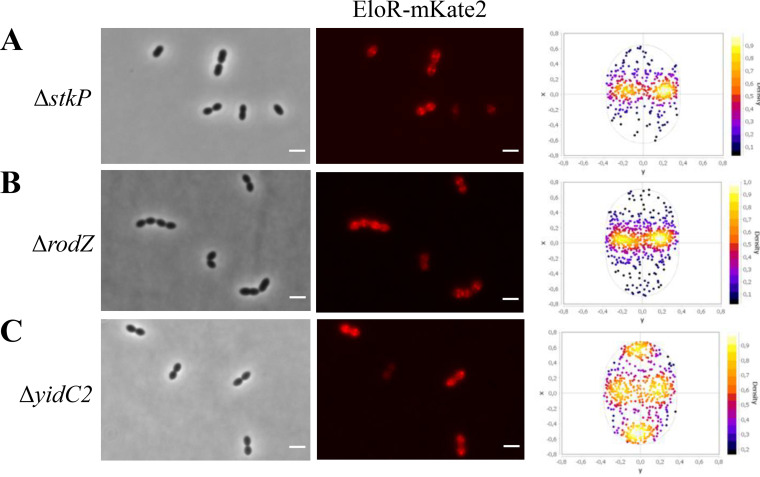
FIG 2.
EloR-mKate2 localization in different genetic backgrounds. The subcellular localization of EloR-mKate2 in ΔstkP (n = 1,155) (A), ΔrodZ (n = 1,681) (B), and ΔyidC2 (n = 1,280) (C) mutants is shown by microscopy images and corresponding focus density plots of detected foci. n indicates the number of cells analyzed for each strain. x and y in the focus density plots denote the relative length and width axes, respectively. Bars, 2 μm.

