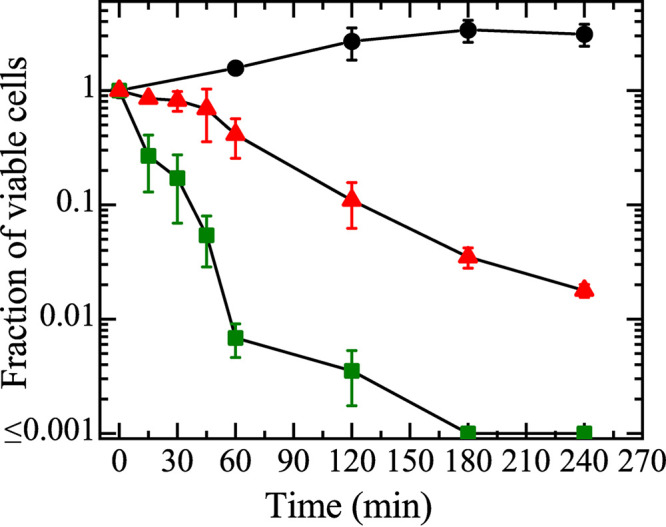
FIG 2.

Time-kill kinetics of Rh-LfcinB(4–9) against E. coli cells. Green squares, 5.0 μM Rh-LfcinB(4–9); red triangles, 2.0 μM Rh-LfcinB(4–9); black circles, cells in the absence of the peptide. Mean values of the fractions of viable cells and their standard deviations are shown.
