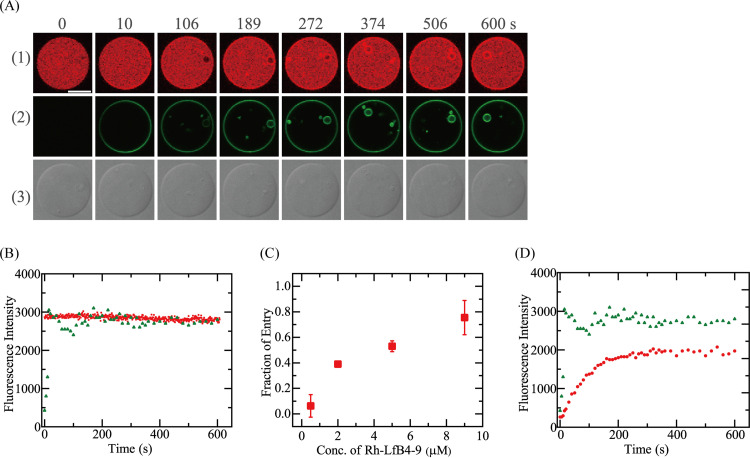
FIG 7.
Interaction of Rh-LfcinB(4–9) with single E. coli-lipid-GUVs containing small GUVs. (A) CLSM images due to AF647 (1) and Rh-LfcinB(4–9) (2) and DIC image of an E. coli-lipid-GUV interacting with 5.0 μM Rh-LfcinB(4–9) in the absence of membrane potential (3). The numbers above each image indicate the time of interaction of Rh-LfcinB(4–9) with the GUV. Bar, 30 μm. (B) Time course of the change in the FI of the GUV shown in panel A over time. Red squares and green triangles correspond to the FI of the GUV lumen due to AF647 and that of the GUV rim due to Rh-LfcinB(4–9), respectively. (C) Dependence of Pentry(10 min) on the peptide concentration. (D) Time course of the change in the rim intensity. Red circles and green triangles correspond to the rim intensities in the presence of 0.5 and 5.0 μM Rh-LfcinB(4–9), respectively.

