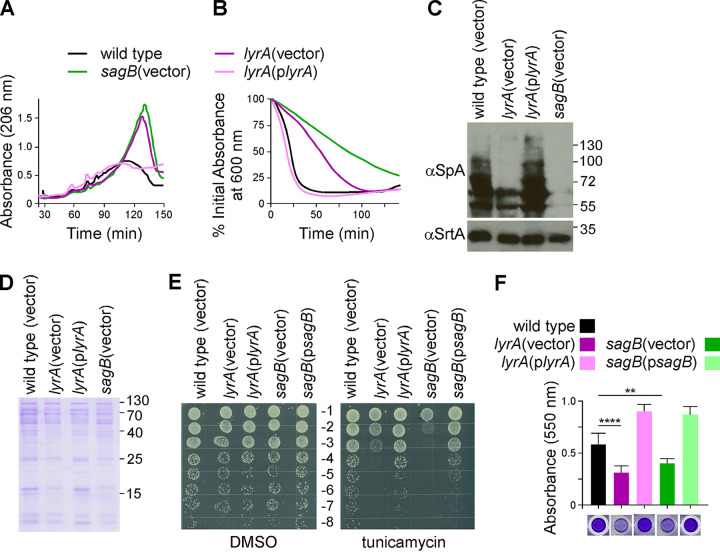
FIG 2.
The lyrA and sagB mutants phenocopy one another. (A) Peptidoglycan purified from indicated strains was digested with lysostaphin and analyzed by RP-HPLC using a C18 column. (B) Lysostaphin resistance was determined by measuring percentage drop in absorbance of 600 nm over time following addition of lysostaphin. The graph displays the average of three technical repeats per strain and is representative of at least three biological repeats. Error bars have been omitted for clarity. (C) Cell lysates of indicated strains were subjected to immunoblotting with αSpA and αSrtA antibodies. (D) Proteins secreted into the culture medium were concentrated by TCA precipitation, separated by SDS-PAGE. A Coomassie stain of a representative gel is shown. (E) A serial dilution series (−1 through −8) of the strains indicated was plated on tryptic soy agar supplemented with tunicamycin or vehicle only (DMSO) as indicated. The experiment was performed in technical and biological triplicate; a representative image is shown. (F) Biofilm formation after 24 h static growth was measured using a microtiter plate crystal violet assay. Columns represent the mean from 6 technical replicates, and the error bars are the standard deviation. Ordinary one-way ANOVA was used to compare the results with one another. Each comparison was statistically significant, except for lyrA(vector) versus sagB(vector). Statistical significance for lyrA(vector) or sagB(vector) compared to wild type are indicated on the graph: ****, P < 0.0001; **, P < 0.005. Result is representative of 3 biological repeats.

