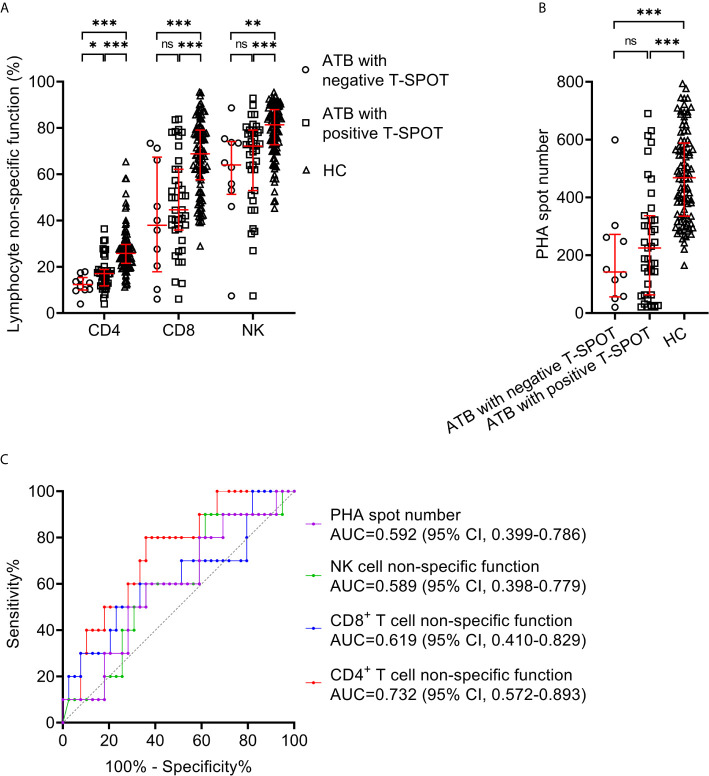
Figure 2.
Lymphocyte non-specific function detection for identifying ATB patients with false-negative T-SPOT result. (A) Scatter plots showing the results of lymphocyte non-specific function in ATB with negative T-SPOT result (n=10),ATB with positive T-SPOT result (n=39) and HC (n=95). Bars indicated the medians and interquartile ranges. *P < 0.05; **P < 0.01; ***P < 0.001; ns, no significance (Mann-Whitney U test). (B) Scatter plots showing PHA spot number in ATB with negative T-SPOT result (n=10), ATB with positive T-SPOT result (n=39) and HC (n=95). Bars indicated the medians and interquartile ranges. ***P < 0.001; ns, no significance (Mann-Whitney U test). (C) ROC analysis showing the performance of CD4+ T cell non-specific function, CD8+ T cell non-specific function, NK cell non-specific function, and PHA spot number in distinguishing ATB patients with negative T-SPOT result from those with positive T-SPOT result. ATB, active tuberculosis; HC, healthy controls; PHA, phytohemagglutinin; ROC, receiver operating characteristic; AUC, area under the curve; CI, confidence interval.

