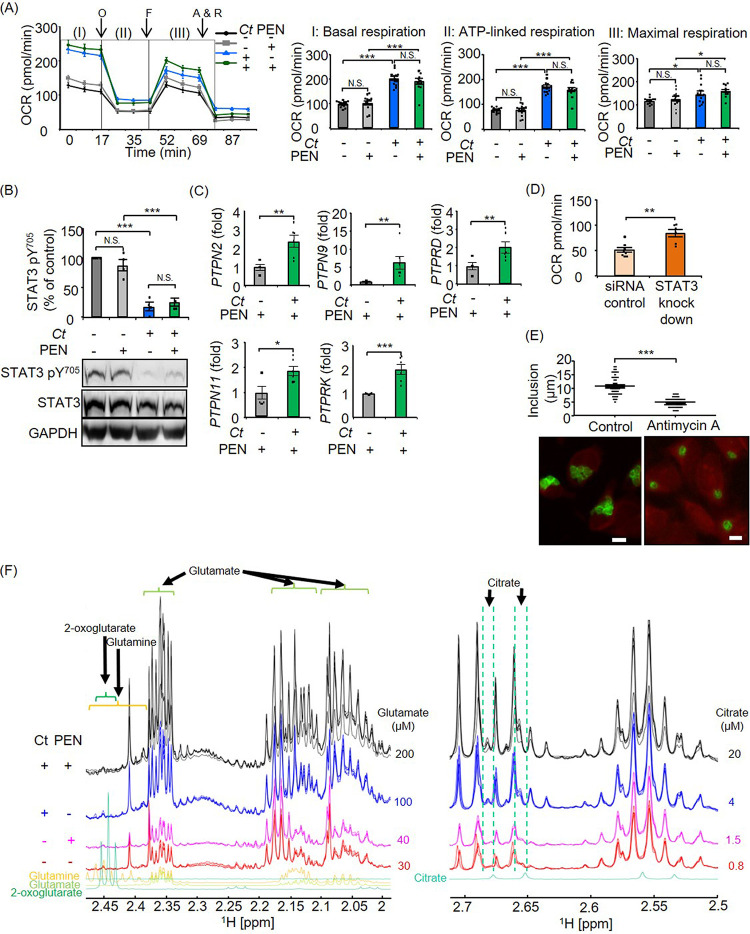
FIG 1.
Analysis of mitochondrial activities and STAT3 regulation in productive and penicillin (PEN)-induced chlamydial persistence. (A) Mitochondrial activity was measured by using a Mito stress test kit at 24 hpi. OCR, oxygen consumption rate; O, oligomycin; F, carbonyl cyanide-4-(trifluoromethoxy)phenylhydrazone (FCCP); A & R, antimycin A plus rotenone. I, II, and III indicate basal respiration, ATP-linked respiration, and maximal respiration, respectively. (B) STAT3 pY705 in productive and penicillin-induced chlamydial persistence was analyzed by Western blot and densitometric analyses at 24 hpi. STAT3 pY705 was normalized to total STAT3 proteins. (C) Expression of PTPs in penicillin-induced chlamydial persistence was analyzed by qRT-PCR at 24 hpi. (D) Maximal respiration of siRNA control cells and STAT3 knockdown cells (STAT3HSS186130) in penicillin-induced chlamydial persistence. (E) Size of inclusions and representative images of penicillin-induced chlamydial persistence in 0.2 μM antimycin A-treated and nontreated cells at 24 hpi. Bars = 10 μm. (F) Section of 1H-NMR spectra expanded between 2 and 2.45 ppm and between 2.5 and 2.7 ppm of deproteinized extracts of control cells (red lines), penicillin-treated cells (magenta lines), C. trachomatis (Ct)-infected cells (blue lines), and C. trachomatis-infected cells in the presence of penicillin (black lines). Signals arising from each of these metabolites are marked. Deconvolution of overlapping signals was achieved using Chenomx software. Glutamate and citrate concentrations are shown on the right side of each line (n = 12 to 14 from four independent experiments [A], n = 4 [B], n = 6 [C], n = 6 to 8 from two independent experiments [D], n = 57 to 77 [E], and n = 3 to 5 [F]) (means ± SEM) (*, P ≤ 0.05; **, P ≤ 0.01; ***, P ≤ 0.001; N.S., not significant [by Sidak’s multiple-comparison test {A and B} and Student’s t test {C to E}]).

