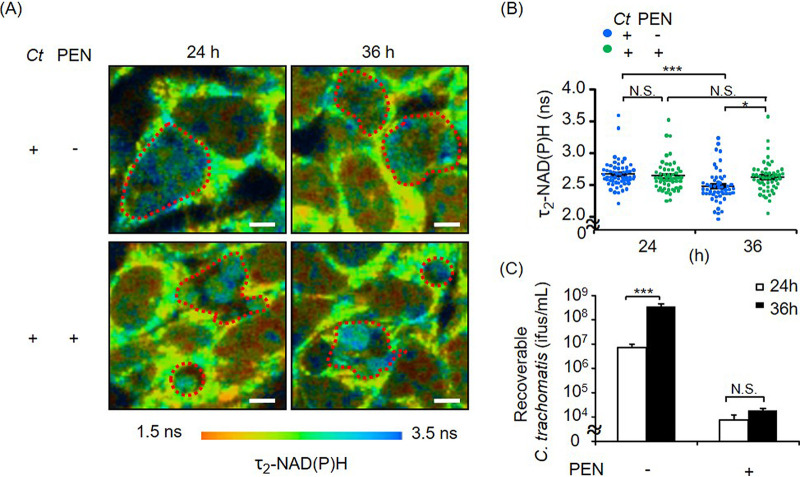
FIG 2.
FLIM of NAD(P)H in productive C. trachomatis (Ct) and penicillin (PEN)-induced chlamydial persistence. τ2-NAD(P)H in chlamydial inclusions was analyzed by two-photon microscopy. This enabled real-time imaging of chlamydial metabolic changes. (A and B) Color-coded images of τ2-NAD(P)H (A) and the corresponding quantitative analysis (B) of chlamydial inclusions. Inside the red dots are chlamydial inclusions. Bars = 10 μm. (C) Numbers of EBs shown by recovery assays at 24 and 36 hpi. (n = 51 to 57 from three independent experiments [A and B] and n = 3 to 4 [C]) (means ± SEM) (*, P ≤ 0.05; ***, P ≤ 0.001; N.S., not significant [by Sidak’s multiple-comparison test]).

