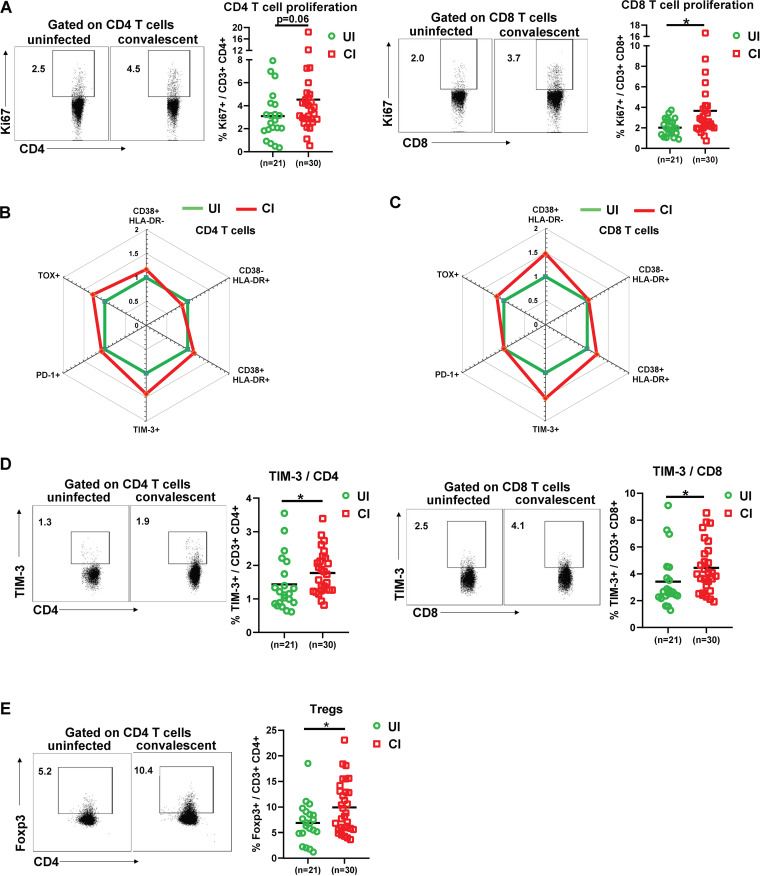
FIG 3.
Characterization of T cell phenotypes in the PBMCs of individuals recovering from COVID-19. (A) The percentages of Ki67+ CD4 and CD8 T cells in the blood of UI (n = 21) and CI (n = 30) were analyzed by flow cytometry. (B and C) The fold changes of the percentages (median) of CD38+ HLA-DR−, CD38− HLA-DR+, CD38+ HLA-DR+, PD-1+ TOX−, PD-1− TOX+, PD-1+ TOX+, and TIM-3+ CD4 and CD8 T cells in the blood of CI (n = 30) compared to those of UI (n = 21) are depicted by radar plots. (D) The percentages of TIM-3+ CD4 and CD8 T cells in the blood of UI (n = 21) and CI (n = 30) were analyzed by flow cytometry. (E) The percentages of Foxp3+ CD4 T cells in the blood of UI (n = 21) and CI (n = 30) were analyzed by flow cytometry. CI, COVID-19-convalescent individuals; UI, SARS-CoV-2-unexposed individuals. Statistically significant differences are indicated by asterisks (*, <0.05; **, <0.01; nonparametric Mann-Whitney test).

