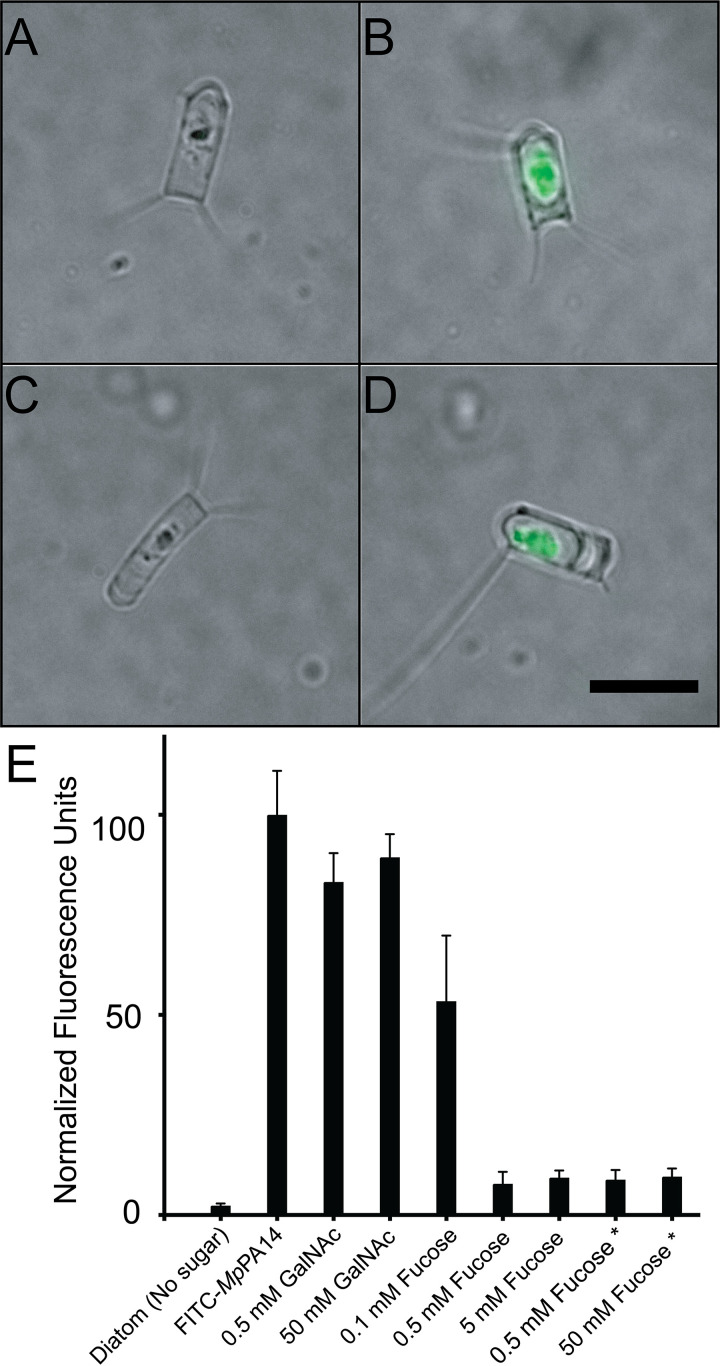
FIG 5.
Inhibition of MpPA14 binding to the diatom C. neogracile. Representative images showing (A) an untreated C. neogracile diatom with basal autofluorescence in the center from its cell; (B) a C. neogracile cell treated with 0.2 mg/ml fluorescein isothiocyanate (FITC)-labeled MpPA14; (C) a C. neogracile cell treated with 0.5 mM l-fucose and 0.2 mg/ml FITC-labeled MpPA14; and (D) a C. neogracile cell treated with 0.2 mg/ml FITC-labeled MpPA14 and 50 mM GalNAc. All four images (A to D) are at the same scale, with the black scale bar in panel D indicating 10 μm. (E) Fluorescence levels shown by the C. neogracile cells alone and those treated with various ligands. Each bar represents the quantification of average fluorescence from 30 individual diatoms. Data bars with an asterisk underneath represent experiments where diatoms were incubated with FITC-MpPA14 before l-fucose was added.

