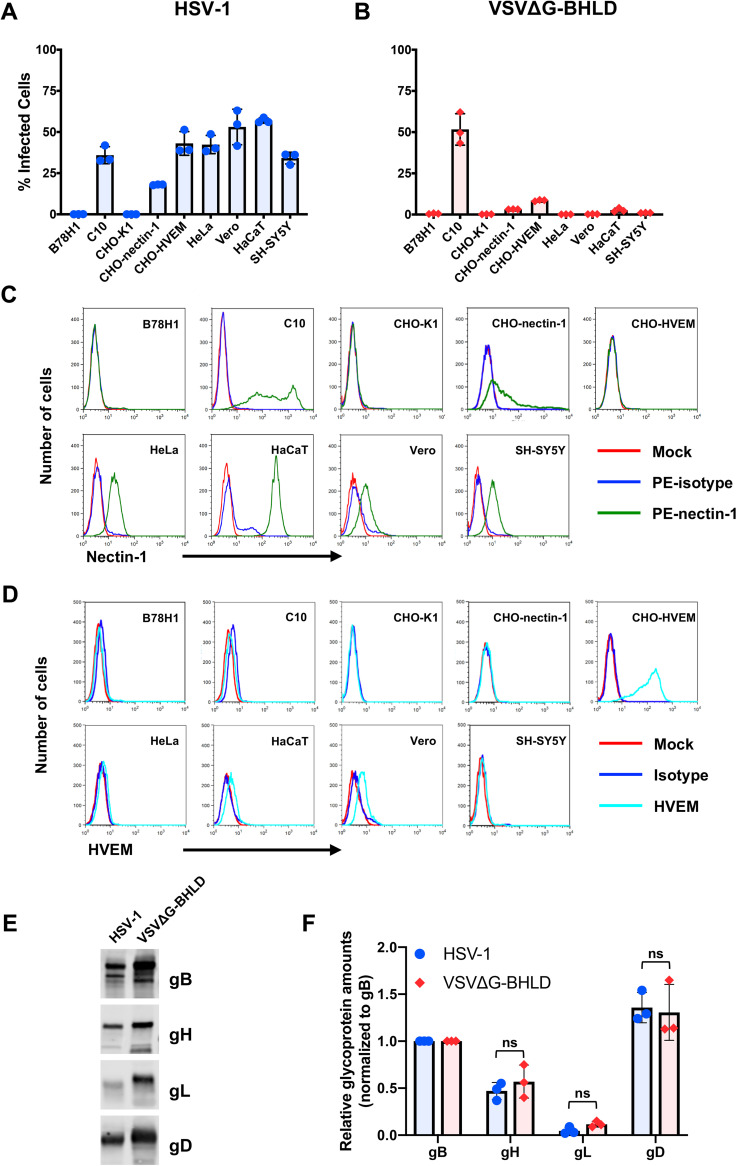
FIG 1.
VSVΔG-BHLD pseudotype narrow cellular tropism is not due to differences in relative glycoprotein ratios or receptor expression levels. HSV-1 (A) and VSVΔG-BHLD (B) entry was assessed on nine cell lines, B78H1, C10, CHO-K1, CHO-nectin-1, CHO-HVEM, HeLa, Vero, HaCaT, and SH-SY5Y. Cells were infected at an MOI of 1. Entry was quantitated by flow cytometry at 6 h postinfection. Cell surface expression of nectin-1 (C) and HVEM (D) was analyzed by flow cytometry. Surface levels of nectin-1 were quantitated by staining cells with an anti-nectin-1 monoclonal antibody CK41 conjugated to phycoerythrin (PE) (green histograms). Surface levels of HVEM were quantitated by staining cells with an anti-HVEM polyclonal antibody R140 and a FITC-labeled secondary antibody (cyan). Blue histograms are isotype controls. Red histograms are mock (no antibody) controls. (E and F) Relative ratios of gB/gH/gL/gD for HSV-1 and VSVΔG-BHLD particles. HSV-1 and VSVΔG-BHLD virions were purified either through a continuous sucrose gradient (HSV-1) or continuous OptiPrep gradient (VSVΔG-BHLD), pelleted, and analyzed for their glycoprotein content (gB, gH, gL, and gD) by Western blotting (anti-gB polyclonal antibody [pAb] R68, anti-gH pAb R137, anti-gL MAb L1, and anti-gD pAb R7). A representative Western blot is shown. The amounts of gB, gH, gL, and gD in three different virion preparations were determined by densitometry. Levels of gH, gL, and gD were normalized to gB levels from their respective virions. A Student’s t test with Welch’s correction was used to determine the significance of differences between relative amounts of gH, gL, or gD between HSV-1 and VSVΔG-BHLD virions. ns, not significant.

