FIG 2.
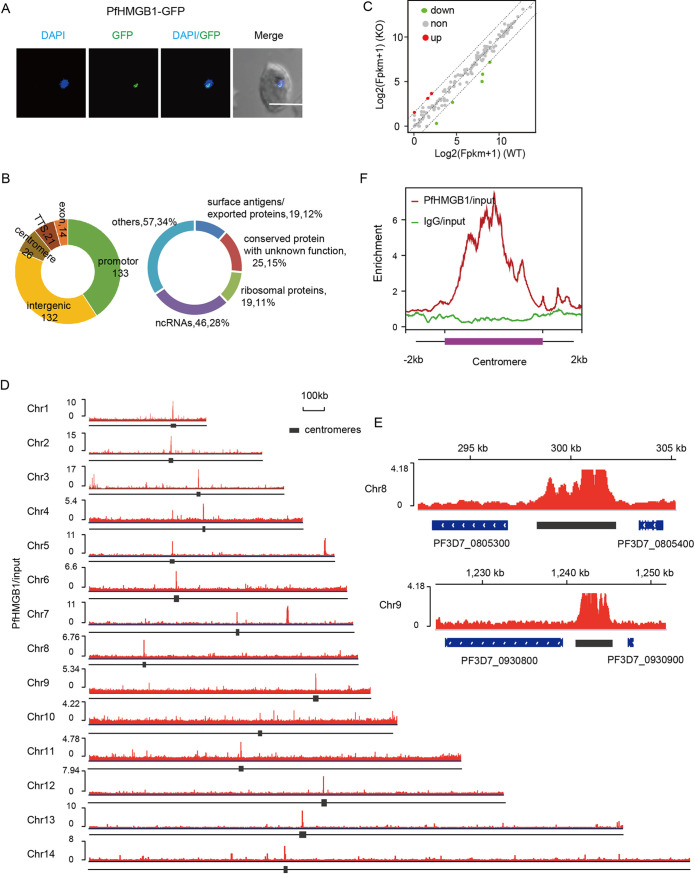
PfHMGB1 is preferentially enriched in centromeric regions. (A) Live-cell fluorescence assay of PfHMGB1-GFP. The nuclei are stained by DAPI. Bar, 5 μm. (B, left) Distribution of PfHMGB1 peaks at the whole-genome level. The numbers indicate the number of the enriched peaks for each region (see Table S1C in the supplemental material). (Right) Detailed classification of PfHMGB1 binding genes. (C) Transcriptomic changes of PfHMGB1 binding genes in WT and Pfhmgb1-KO clones. All the significantly up- and downregulated genes (≥3-fold change) are indicated with red and green circles, respectively. Dashed lines indicate the fold change cutoff. (D) IGV snapshots of PfHMGB1 binding sites at 14 chromosomes. Black boxes indicate the location of centromeres. The enrichment of PfHMGB1 signal was normalized with input. (E) Integrative Genomics Viewer (IGV) snapshots of PfHMGB1 binding sites at centromere regions of indicated chromosomes. (F) ChIP-seq enrichment profile of PfHMGB1 (red line) and IgG control (green line) at the region of centromeres. Both PfHMGB1 (red line) and IgG were normalized with genomic input signal.

