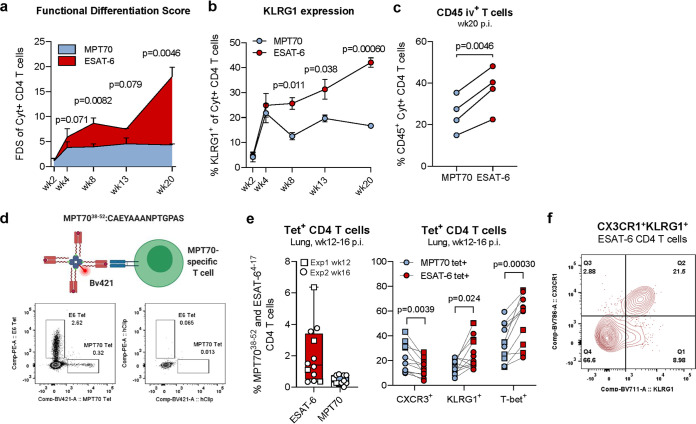
FIG 2.
MPT70-specific CD4 T cells maintain a low differentiation state compared to ESAT-6. (a) The functional differentiation score (FDS) of MPT70- and ESAT-6-specific CD4 T cells over the course of Mtb Erdman infection (n = 4). The FDS is defined as the ratio of all IFN-γ-producing CD4 T cell subsets divided by subsets producing other cytokines (IL-2, TNF-α), but not IFN-γ (high FDS = high IFN-γ production). Multiple t tests with correction for multiple testing using the Holm-Sidak method were used to assess statistical differences. Values shown are means ± SEM. Flow cytometry gating is shown as depicted in Fig. S1a in the supplemental material, using the antibodies shown in Table 4. (b) Frequencies of KLRG1-expressing MPT70- and ESAT-6-specific CD4 T cells throughout infection (n = 4). Values shown are means ± SEM. Multiple t tests with correction for multiple testing using the Holm-Sidak method were used to assess statistical differences. (c) Frequency of CD45-labeled MPT70- and ESAT-6-specific CD4 T cells in the lung-associated vasculature (CD45+) 20 weeks postinfection (p.i.) with Mtb (n = 4). A two-tailed, paired t test was used. (d, top) Schematic representation of custom-made I-Ab:MPT7038-52 MHC-II tetramer. (d, bottom) Representative concatenated FACS plots showing frequencies of I-Ab:MPT7038-52 and I-Ab:ESAT-64-17 tetramer (Tet)-positive CD4 T cells or corresponding hClip tetramer-positive CD4 T cells in lungs of mice 12 weeks after Mtb infection (n = 4). (e) Frequency of I-Ab:MPT7038-52 and I-Ab:ESAT-64-17 CD4 T cells 12 to 16 weeks after Mtb infection expressing CXCR3, KLRG1, and T-bet. A parametric, two-tailed, paired t test was used to assess statistical differences (n = 12). Flow cytometry gating is shown as depicted in Fig. S3 using the antibodies shown in Table 3. (f) Concatenated FACS plot of CX3CR1+ KLRG1+ coexpressing ESAT-64-17 CD4 T cells (n = 4).

