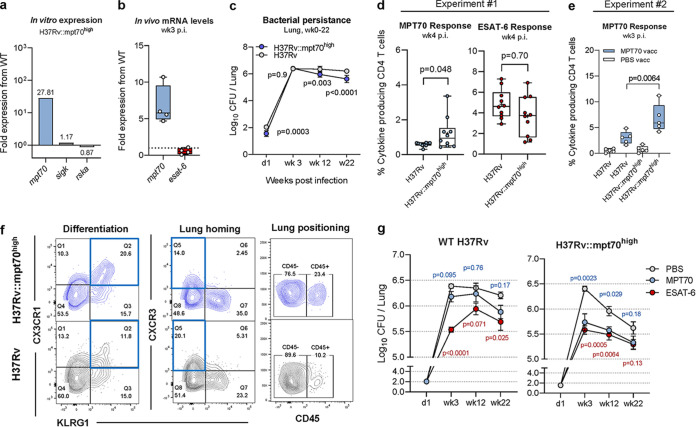
FIG 4.
Overexpression of MPT70 accelerates T cell differentiation and increases bacterial susceptibility to MPT70 vaccination. (a) In vitro fold gene expression of sigK, rskA, and MPT70 in H37Rv::mpt70high compared to WT H37Rv. All genes were tested in technical duplicates and normalized to esxA expression using primers in Table 1. (b) In vivo fold gene expression of MPT70 and ESAT-6 in the lungs of H37Rv::mpt70high-infected mice compared to WT H37Rv-infected mice 3 weeks after Mtb challenge (n = 4). Genes were analyzed in technical duplicates using primers and probes in Table 2, normalized to 16S rRNA expression, and shown as fold increase from WT H37Rv. A two-tailed, unpaired t test was used to assess statistical differences. (c) Bacterial burden in the lungs of mice injected with PBS at day 1, week 3, week 12, and week 22 after infection with either H37Rv:: mpt70high or WT H37Rv infection (n = 5). Values shown are means ± SEM. Multiple t tests with correction for multiple testing using the Holm-Sidak method were used to assess statistical differences. (d) Frequency of lung MPT70- and ESAT-6-specific CD4 T cells 4 weeks after Mtb infection (n = 10). Box plots with whiskers indicating the minimum and maximum values are shown. The mean values are indicated with + symbols. A unpaired, two-tailed t test was used to assess statistical differences. (e) Frequency of lung MPT70-specific CD4 T cells 3 weeks after Mtb infection in mice injected with PBS (white boxes) and mice vaccinated with MPT70 (blue boxes) (n = 5). A unpaired, two-tailed t test was used to assess statistical differences. (f) Representative concatenated FACS plots (n = 10) showing the expression of CX3CR1, CXCR3, KLRG1, or CD45 on MPT70-specific CD4 T cells 4 weeks after H37Rv:: mpt70high infection (blue) or H37Rv infection (gray). Flow cytometry gating is shown as depicted in Fig. S1a, using antibodies shown in Table 5. (g) Bacterial numbers were determined in the lungs of mice vaccinated with PBS or mice vaccinated with MPT70 and ESAT-6 at day 1, week 3, week 12, and week 22 after WT H37Rv infection (left) or H37Rv::mpt70high infection (right) (n = 4 to 5). One mouse was excluded from the week 12 time point (H37Rv::mpt70high, MPT70 vaccinated), as the mouse was very sick, had high weight loss, and met the study’s predefined humane endpoints (P value = 0.67, if included). Values shown are means ± SEM. Statistical differences were assessed using one-way ANOVA with Tukey’s multiple-comparison test.

