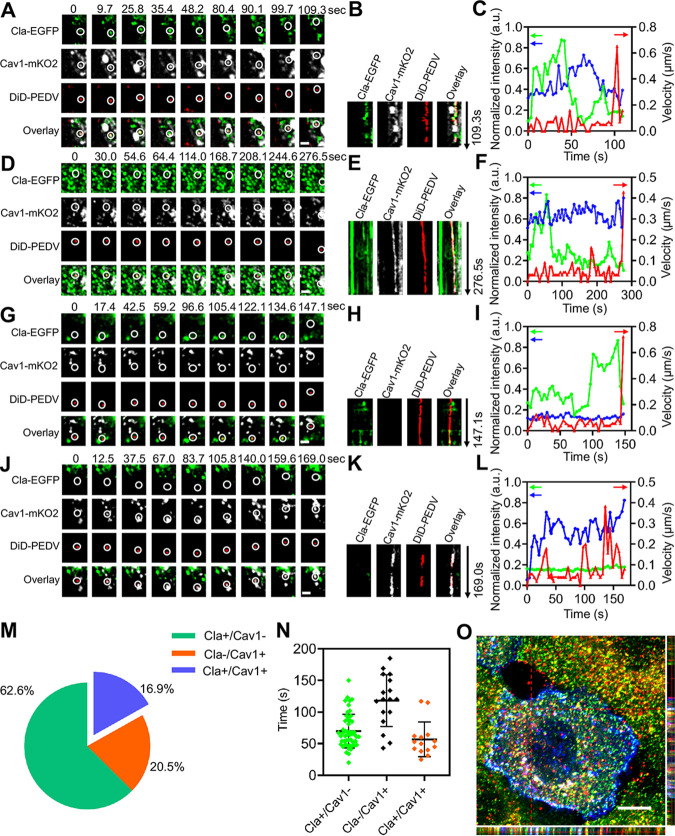
FIG 6.
Productive C3ME of PEDV. (A to C) PEDV infection via C3ME captured by triple-color confocal microscope. (A) Time-lapse images of PEDV (red) entering cells coexpressing Cla-EGFP (green) and Cav1-mKO2 (white). Scale bar, 2 μm. (B) Kymographs at viral binding site. (C) Time-lapse clathrin and caveolin-1 fluorescence intensities at the viral binding site and PEDV velocity. (D to F) PEDV infection via C3ME captured by triple-color TIRF microscope. (D) Time-lapse images of PEDV (red) entering cells coexpressing Cla-EGFP (green) and Cav1-mKO2 (white). Scale bar, 2 μm. (E) Kymographs at the viral binding site. (F) Time-lapse clathrin and caveolin-1 fluorescence intensities at the viral binding site and PEDV velocity. (G to I) PEDV infection via CME captured by triple-color confocal microscope. (G) Time-lapse images of PEDV (red) entering cells coexpressing Cla-EGFP (green) and Cav1-mKO2 (white). Scale bar, 2 μm. (H) Kymographs at viral binding site. (I) Time-lapse clathrin and caveolin-1 fluorescence intensities at the viral binding site and PEDV velocity. (J to L) PEDV infection via CavME captured by triple-color confocal microscope. (J) Time-lapse images of PEDV (red) entering cells coexpressing Cla-EGFP (green) and Cav1-mKO2 (white). Scale bar, 2 μm. (K) Kymographs at the viral binding site. (L) Time-lapse clathrin and caveolin-1 fluorescence intensities at the viral binding site and PEDV velocity. (M) Proportion of PEDVs entering cells via CME (n = 52), CavME (n = 17), and C3ME (n = 14). (N) Duration in different pathways; error bars represent SD (n = 83). (O) 3D fluorescence colocalization imaging on CCP, caveolae, and PEDV using confocal microscope. Scale bar, 10 μm.

