FIG 9.
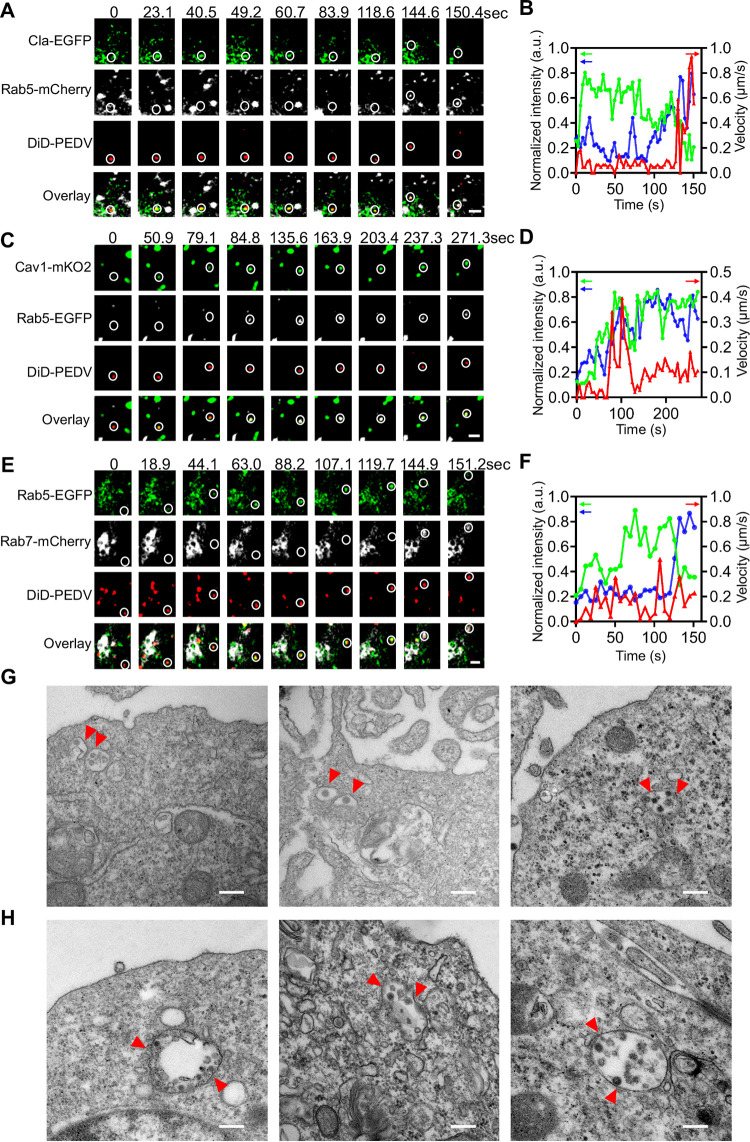
PEDV trafficking from early to late endosomes. (A) Time-lapse images of PEDV (red) via CME from CCP (green) to Rab5 positive early endosome (white). Scale bar, 2 μm. (B) Time-lapse Cla-EGFP (green) and Rab5-mCherry (blue) fluorescence intensities at viral binding site and PEDV velocity (red) corresponding to (A). (C) Time-lapse images of PEDV (red) via CavME from caveolae (green) to Rab5 positive early endosome (white). Scale bar, 2 μm. (D) Time-lapse Cav1-mKO2 (green) and Rab5-EGFP (blue) fluorescence intensities at viral binding site and PEDV velocity (red) corresponding to (C). (E) Time-lapse images of PEDV (red) transporting from early endosome (green) to late endosome (white). Scale bar, 2 μm. (F) Time-lapse Rab5-EGFP (green) and Rab7-mCherry (blue) fluorescence intensities at viral binding site and PEDV velocity (red) corresponding to (E). (G, H) Ultrastructural analysis on the internalization of PEDV particles in endosomes. Scale bar, 200 nm.

