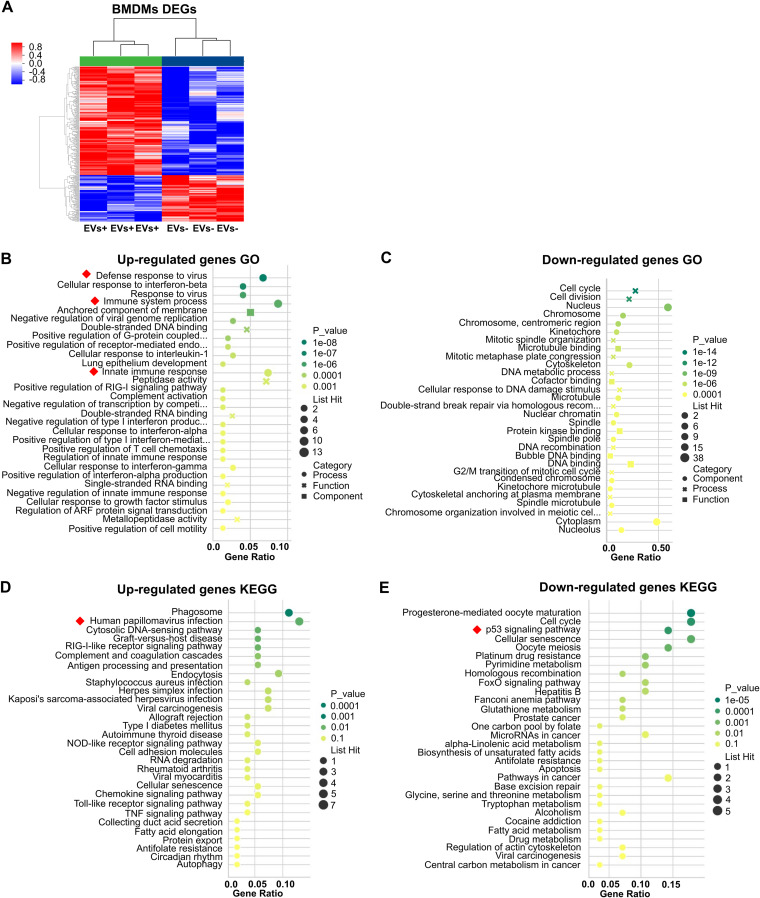
FIG 3.
Transcriptional changes in naive BMDMs incubated with live-BM-EVs. EV-nontreated BMDMs were used as a control. (A) Volcano plot of differentially expressed genes (DEGs) in EV-treated and untreated groups. Red, upregulated; blue, downregulated (n = 3 for each group). (B and C) GO analysis of upregulated (B) and downregulated (C) DEGs. (D and E) KEGG analysis of upregulated (D) and downregulated (E) DEGs. Red squares indicate immune-related pathways.

