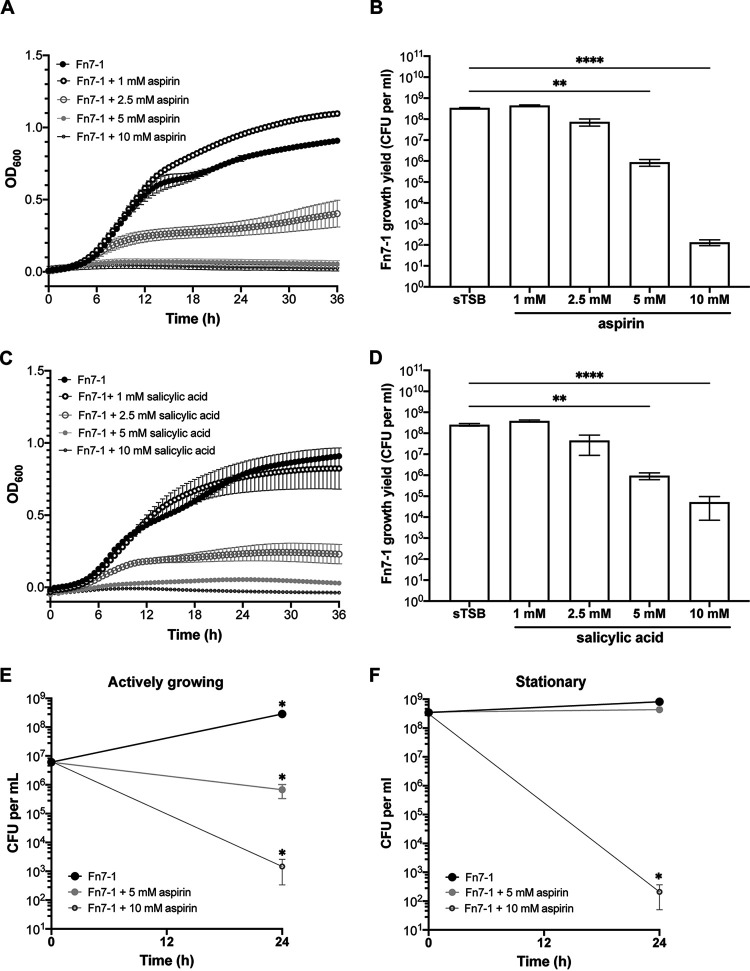
FIG 1.
Fn7-1 responses to aspirin and salicylic acid in culture. (A and C) Growth curve as determined by OD600 for Fn7-1 grown in sTSB supplemented with different concentrations of aspirin or salicylic acid. (B and D) Fn7-1 growth after 24 h in indicated media, as determined by final CFUs per ml of culture. (E and F) Fn7-1 growth at t0 and after 24 h in indicated media, as determined by CFU per ml of culture. For actively growing cells (E), cultures were inoculated 1:100 from an overnight preculture into indicated media. For stationary-phase cells (F), cells were pelleted and washed into fresh, prereduced indicated media. All data represent the mean ± SEM for at least 6 cultures. For A and C, data were analyzed by two-way repeated measures analysis of variance (ANOVA) with post hoc Dunnett’s test. For aspirin, samples are significantly different from sTSB at P values of <0.05 beginning at 7.5 h (5 mM and 10 mM), 9.5 h (2.5 mM), or 17 h (1 mM). For salicylic acid, samples are significantly different from sTSB at P values of <0.05 beginning at 8 h (10 mM), 8.5 h (5 mM), or 11.5 h (2.5 mM). For B and D, ** indicates P values of <0.01 and **** indicates P values of <0.0001 as determined by Kruskal-Wallis test with post hoc Dunn’s test for multiple comparisons to the control medium sample. For E and F, Wilcoxon signed-rank test was performed for each condition at 24 h compared with t0. *, P < 0.05.

