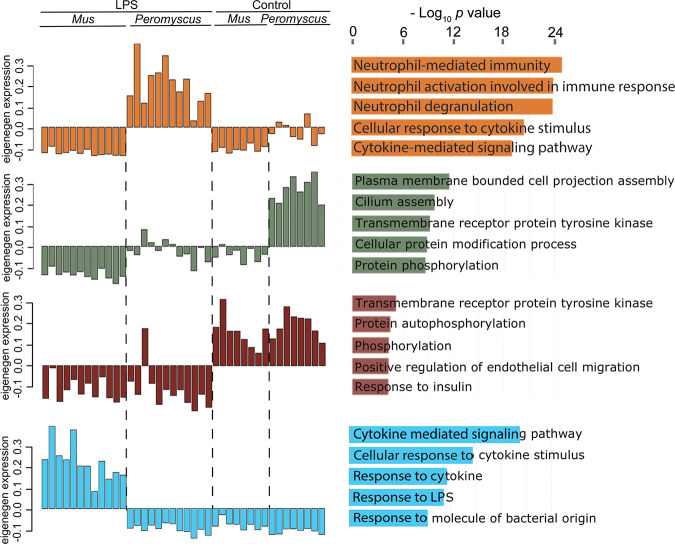
FIG 5.
Four selected Eigengene modules by network analysis of differential responses of P. leucopus or M. musculus animals to LPS. The different modules are distinguished by the color of the hexadecimal scheme: dark orange 2 for upregulated in LPS-treated P. leucopus, dark sea green 4 for comparatively higher expression in untreated P. leucopus than in the other three groups, brown 4 for downregulated in both species after LPS treatment, and light blue for upregulated in LPS-treated M. musculus. The top 5 GO terms by adjusted P value are shown for each module. The DEGs constituting each of the GO term sets from this analysis are listed in Table S4 along with P values and odds ratios. The other 20 modules from this analysis are available at the Dryad repository (https://doi.org/10.7280/D1B38G).

