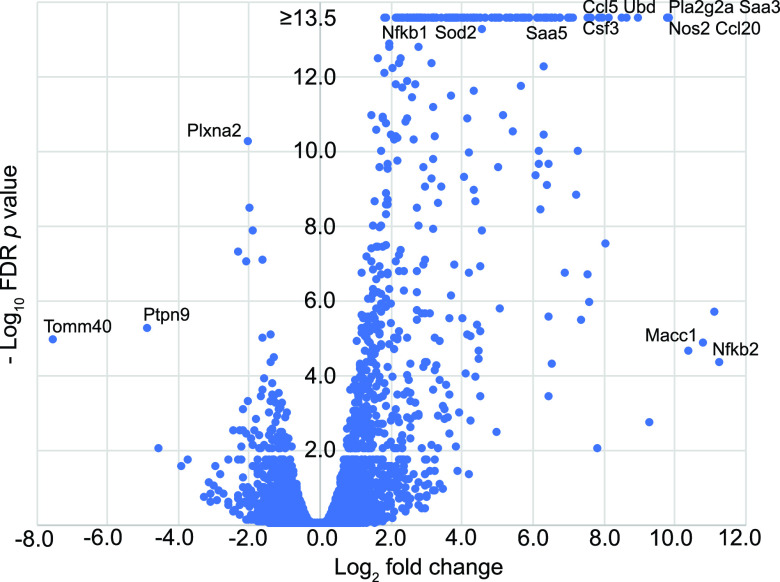
FIG 9.
Volcano plot of RNA-seq results for pairs of P. leucopus fibroblast cultures with or without exposure to LPS. Fold changes for 543 genes are given on the x axis, and false discovery rate P values are given on the y axis. For conciseness, the upper limit for the –log10 values for this graph was 13.5. The exact or approximate locations of selected differentially expressed genes are shown. Numerical values for each gene in the data set are provided in the Dryad repository (https://doi.org/10.7280/D1MD69).

