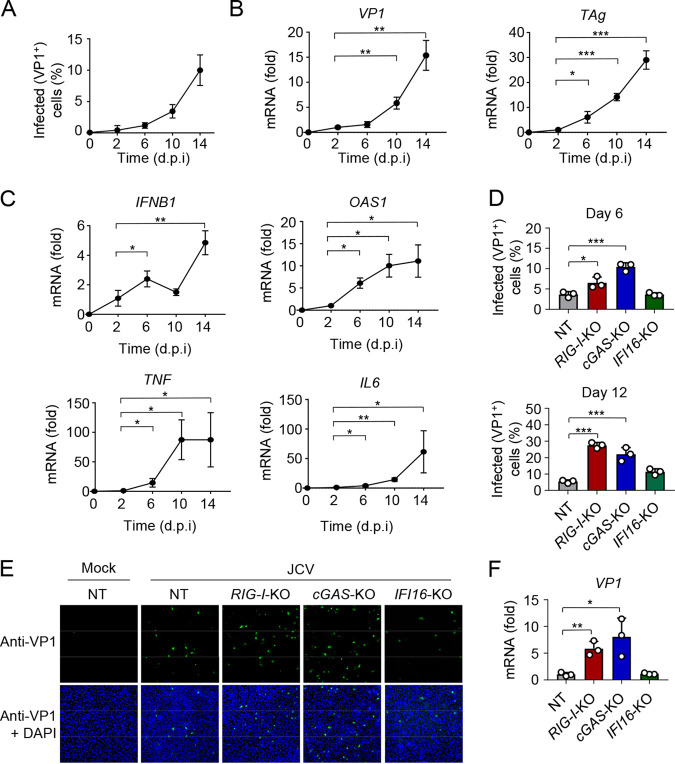
FIG 1.
RIG-I and cGAS control JCV replication in human glial astrocyte cells. (A) Frequency of JCV-positive SVGA cells that were infected with JCV (multiplicity of infection [MOI], 0.2) for the indicated times, determined by immunostaining with anti-VP1 and FACS analysis. (B) qRT-PCR analysis of JCV VP1 (left) and TAg (right) transcripts in SVGA cells that were infected with JCV (MOI, 0.2) for the indicated times. (C) qRT-PCR analysis of IFNB1, OAS1, TNF, and IL6 transcripts in SVGA cells that were infected with JCV (MOI, 0.2) for the indicated times. (D) JCV replication in CRISPR SVGA nontargeting control (NT) cells, or RIG-I-KO, cGAS-KO, or IFI16-KO SVGA cells that were infected with JCV (MOI, 0.2) for 6 (top) or 12 (bottom) days, assessed by immunostaining with anti-VP1 and FACS analysis. (E) JCV infection in CRISPR SVGA NT or KO cells that were infected with JCV (MOI, 0.2) for 6 days, determined by immunostaining with anti-VP1 (green) and confocal microscopy analysis. Mock-infected SVGA NT cells served as an infection specificity control. DAPI was used to stain cell nuclei (blue). (F) qRT-PCR analysis of JCV VP1 transcripts in CRISPR SVGA NT or indicated KO cells that were infected with JCV (MOI, 0.2) for 12 days. Data are means ± standard deviations (SD) (n = 3) and are representative of at least two independent experiments. *, P < 0.05; **, P < 0.005; ***, P < 0.001 (Student's t test in panels A, B, C, D, and F). d.p.i, days postinfection.

