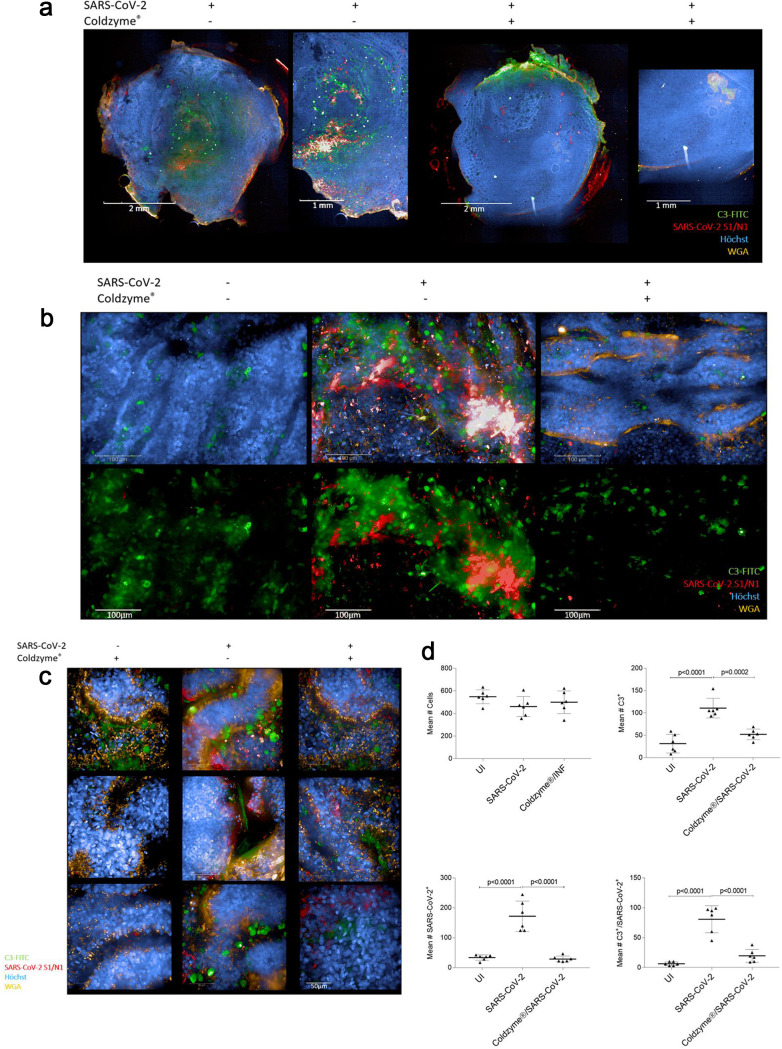
FIG 1.
ColdZyme mouth spray protects primary human airway epithelial (HAE) cells from SARS-CoV-2 binding and innate immune activation. Visualization of virus binding (SARS-CoV-2-S1/N, red) and complement (C3-FITC, green) in SARS-CoV-2-infected 3D pseudostratified epithelia. Multilayered epithelia were apically treated with solvent control or ColdZyme mouth spray prior to exposure to SARS-CoV-2 (MOI 0.1). After 2 h, filters were fixed; stained for Hoechst (blue), SARS-CoV-2-S1/N (red), complement C3 (green), and WGA (orange); and then analyzed by HCS. (a) Overview on the whole Transwell filter of solvent (left)- and ColdZyme (right)-pretreated and infected HAE cultures using ×5 magnification. One representative filter and one detail out of the filter are illustrated. Scale bars represent 2 mm or 1 mm as indicated. (b) Z-stacks of six fields of uninfected (UI, left), SARS-CoV-2-exposed (middle), and ColdZyme/SARS-CoV-2 (right)-exposed cells were analyzed using the Operetta CLS HCS and the 63× water objective. Cells were stained using C3-FITC (green) as indicator for innate immune activation, SARS-CoV-2-S1/N-Alexa 594 (red) for virus detection, Hoechst stain for imaging nuclei (blue), and WGA for staining lectins (orange). Massive IC C3 mobilization and SARS-CoV-2 binding/uptake were monitored in SARS-CoV-2-exposed cultures (middle), while no virus and low C3 signals were detected in UI (left) and ColdZyme/SARS-CoV-2-exposed (right) cultures. Scale bars represent 100 μm, and three independent experiments were performed. (c) Z-stacks of several representative single fields of SARS-CoV-2-exposed regions under the different conditions (ColdZyme/UI, left; SARS-CoV-2, middle; ColdZyme/SARS-CoV-2, right) are shown. Scale bars represent 50 μm, and three independent experiments were performed. (d) More than 2,500 cells (upper left) were analyzed for their expression of C3 (upper right) and SARS-CoV-2 (lower left), where up to 50% of the analyzed SARS-CoV-2-infected cells were stained positive for C3 (upper right) or virus (lower left), while only background signals were detected in UI or ColdZyme/SARS-CoV-2-exposed cells. Too, significantly higher levels of SARS-CoV-2/C3 double-positive cells were analyzed in the infected cultures compared to UI or treated ones (lower right). Statistical significances were analyzed on >2,500 cells with GraphPad Prism software using one-way ANOVA and Tukey’s posttest.

