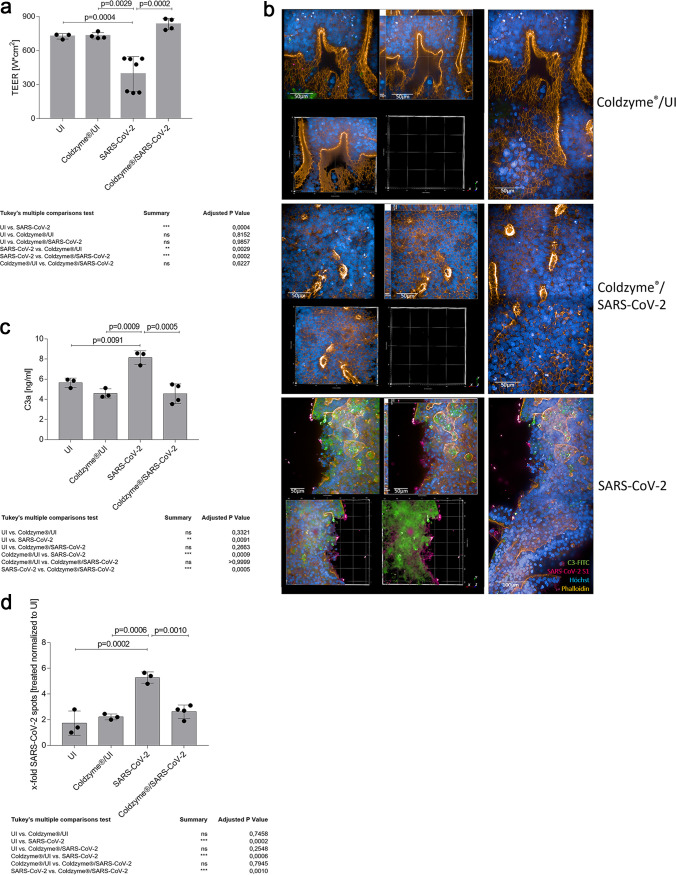
FIG 2.
Disruption of epithelial integrity is contingent on extensive C3 mobilization and C3a secretion by SARS-CoV-2 and can be avoided by ColdZyme pretreatment. (a) Multilayered epithelia were infected by apical addition of SARS-CoV-2 (MOI 0.1) with or without ColdZyme pretreatment and incubated for 72 h. TEER was measured using an EVOM voltohmmeter. TEER in Ω/cm2 was determined for all conditions (UI, ColdZyme/UI, SARS-CoV-2, ColdZyme/SARS-CoV-2) and plotted on a bar graph. Bars represent the mean + SD from 3 to 6 independent pseudostratified epithelia. Statistical significance was calculated using one-way ANOVA with Tukey’s multiple-comparison test. (b) Image analyses of ColdZyme/UI, ColdZyme/SARS-CoV-2, and SARS-CoV-2 primary HAE cells. Filters were differentially treated according to the labeling, fixed after 3 days, and stained using C3-FITC (green), SARS-CoV-2-S1 (red), phalloidin (orange), and Hoechst stain (blue). Image analyses revealed intact epithelial tissue structures (orange) and nuclei (blue) in ColdZyme/UI (upper panel) and ColdZyme/SARS-CoV-2-infected (middle panel) HAE, while tissue integrity was disrupted in SARS-CoV-2-infected cultures, which also illustrated high C3 and SARS-CoV-2-S1 staining (red and green, lower panel). Under each condition, one representative Z-stack (upper left), xyz stack (upper middle), 3D analyses of all stainings (lower left) and virus/C3 stainings (lower middle), and two imaged fields (right) are depicted. Infection experiments were performed three times independently. Scale bars represent 50 μm or 100 μm as indicated. (c) C3a level determination in SARS-CoV-2-infected or ColdZyme-pretreated/SARS-CoV-2-infected pseudostratified epithelia. Multilayered epithelia were pretreated or not with ColdZyme prior to infection with SARS-CoV-2 (MOI 0.1) for 72 h. Uninfected (UI) and ColdZyme/UI cultures served as controls. Basolateral supernatants were harvested, and C3a levels were determined using a BD OptEIA human C3a ELISA kit. C3a levels in ng/ml were determined for all UI and infected epithelia and plotted on a bar graph. Dots represent values from independent experiments. Statistical significance was calculated using one-way ANOVA with Tukey’s multiple-comparison test. (d) Spot analyses were performed on UI, ColdZyme/UI, SARS-CoV-2-infected, and ColdZyme/SARS-CoV-2-infected HAE cultures. SARS-CoV-2 spots (Alexa 594) were counted on an average of 1,200 cells (Hoechst, nuclear count; Alexa 647, cytoplasm) using the RMS spot analyses (Harmony software; Operetta CLS, Perkin-Elmer). Due to background spots in the UI and ColdZyme/UI cultures probably due to autofluorescence of dead cells in the 3D cultures, all conditions were normalized to UI. One out of three representative experiments was set as 1.0, and all other samples were normalized to this. The experiment was repeated at least 3 times, and one-way ANOVA with Tukey’s multiple-comparison test was used to calculate statistical significance. ns, not significant.

