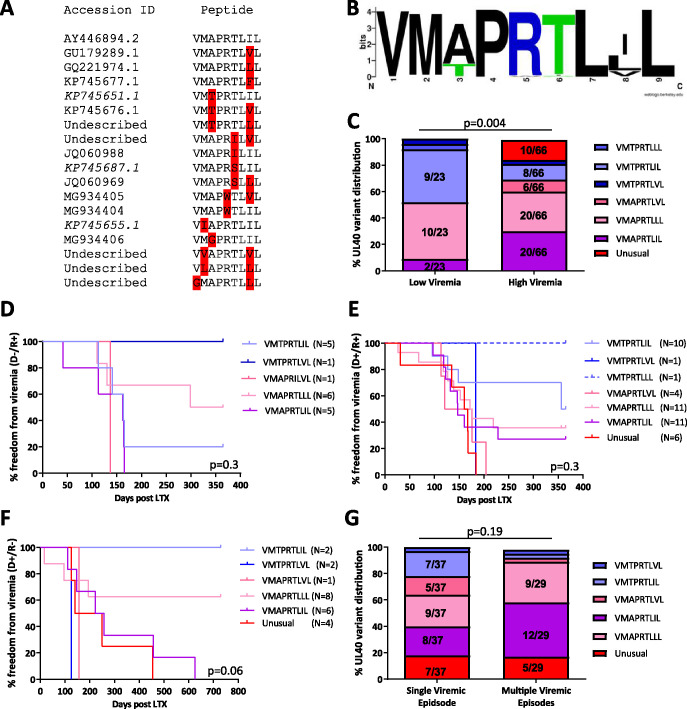
FIG 2.
(A) Sequence alignment of the 18 detected UL40 strains. Variations from the consensus sequence in the DNA and peptide sequence are highlighted in red. (B) Sequence logo alignment of the relative frequency of 90 sequenced UL40 strains. Sequence logos were created with the web tool of the University of California (https://weblogo.berkeley.edu/). (C) Distributions of the six most frequent UL40 variants and the combined “unusual” variant between non-/low-viremic and highly viremic lung transplant recipients (LTR). Bars represent the relative frequency of UL40 strains in each group. χ2 test was used for statistical comparison between variants. (D to F) Kaplan-Meier curves for the freedom from viremia. Curves represent the six most frequent UL40 variants and the combined “unusual” variant in D−/R+ (D), D+/R+ (E), and D+/R− (F) groups. Survival curves were compared with the Mantel-Cox test. (G) Distributions of the five most frequent UL40 variants and the combined “unusual” variant between patients with a single viremic episode or multiple viremic episodes (>1,000 copies/ml blood) in a 1- (R+) or 2-year (D+/R−) follow-up. Bars represent the relative frequency of UL40 strains in each group. χ2 test was used for statistical comparison between variants. D/R, donor and recipient serostatus; LTR, lung transplant recipient.

