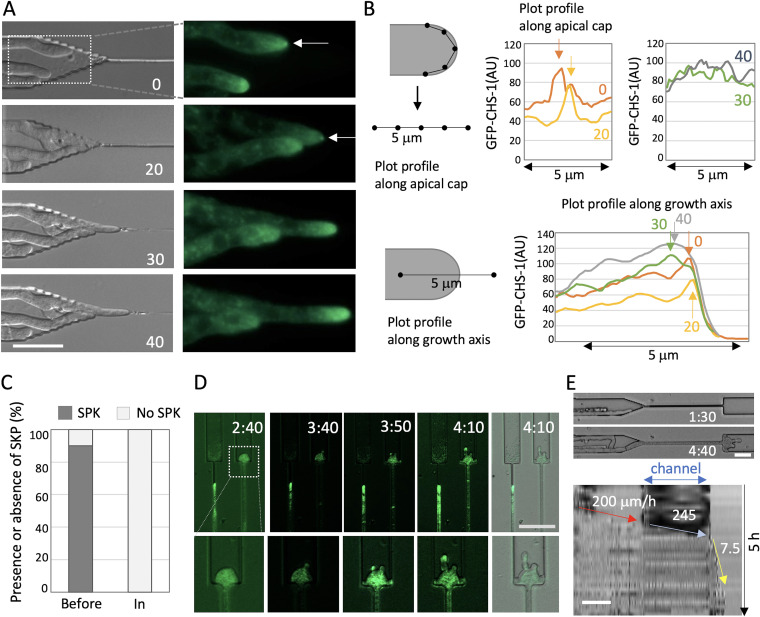
FIG 2.
SPK localization during confined growth in N. crassa. (A) Time series images of N. crassa (DIC, left; CHS-1-GFP, right) hyphae growing into a channel (from Movie S4). The arrows indicate the SPK. The elapsed time is given in minutes. Scale bar 20 μm. (B) Scheme to measure GFP signal intensity along the apical membrane (upper) or the growth axis (lower). The plot profile along the apical membrane (upper) indicates the signal intensity peaks of the SPK (arrows) at 0 or 20 min, but not at 30 or 40 min. The plot profile along the growth axis (lower) indicates the peaks at the apex of hyphae at 0 or 20 min, but at the subapex at 30 or 40 min. (C) Ratio of presence or absence of SPK in hyphae before or in channels; n = 20 or 10, respectively. (D) Image sequence of the depolarized hypha after exiting the channel in the N. crassa (CHS-1- GFP) hyphae (from Movie S5). The elapsed time is given in hours:minutes; scale bar 50 μm. (E) Kymographs along the growth axis of the channel from Movie S5. The hyphal elongation rates before entering, through the channel, and after exiting the channel are shown by arrows. Total 5 h; scale bar 50 μm.

