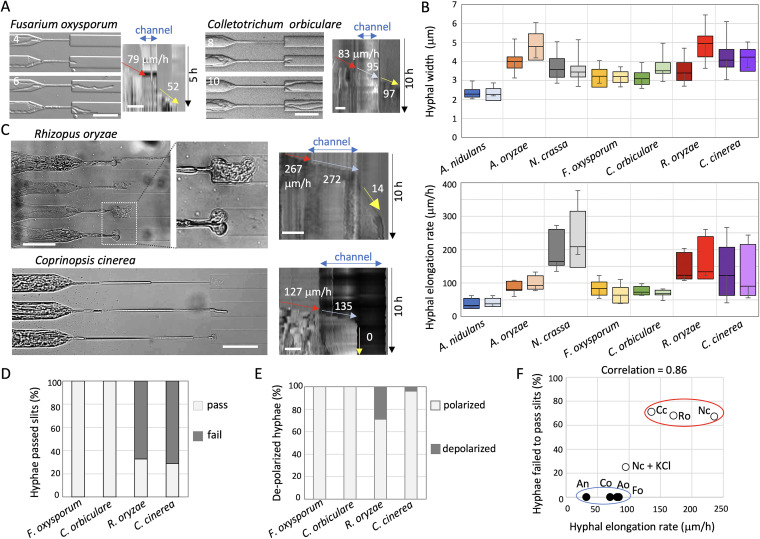
FIG 3.
Relationships among hyphal width, growth rate, and polarity maintenance. (A) Time series of F. oxysporum (left) and C. orbiculare (right) hyphae that passed through the channel (from Movie S6). The elapsed time is given in hours. Kymographs along the growth axis of the channel from Movie S6. The hyphal elongation rates before entering and after exiting the channel are shown by arrows. Total 5 h (left) and 10 h (right); scale bar 50 μm. (B) Boxplots of hyphal width (upper) and hyphal elongation rate (lower) in A. nidulans, A. oryzae, N. crassa, F. oxysporum, C. orbiculare, R. oryzae, and C. cinerea before entering the channels (darker colors) and after exiting the channels (lighter colors); n = 26, 40, 80, 53, 45, 14, and 20, respectively (upper), n = 20 (lower). Depolarized hyphae were not counted. (C) Images of depolarized hyphae of R. oryzae (upper) and of C. cinerea hyphae that stopped growing in the channel or after exiting the channel (lower), from Movie S7. Kymograph along the growth axis of the channel. Total 10 h; scale bar 50 μm. (D and E) Ratio of the hyphae that successfully passed through the channel (pass) or stopped in or just after exiting the channels (fail) (D), and the ratio of depolarized hyphae after exiting the channels (E) in F. oxysporum, C. orbiculare, R. oryzae, and C. cinerea; n = 29, 20, 52, and 52, respectively. (F) Correlation between the hyphal elongation rate with the growth defect in channels. Two groups are shown by red or blue ellipses.

