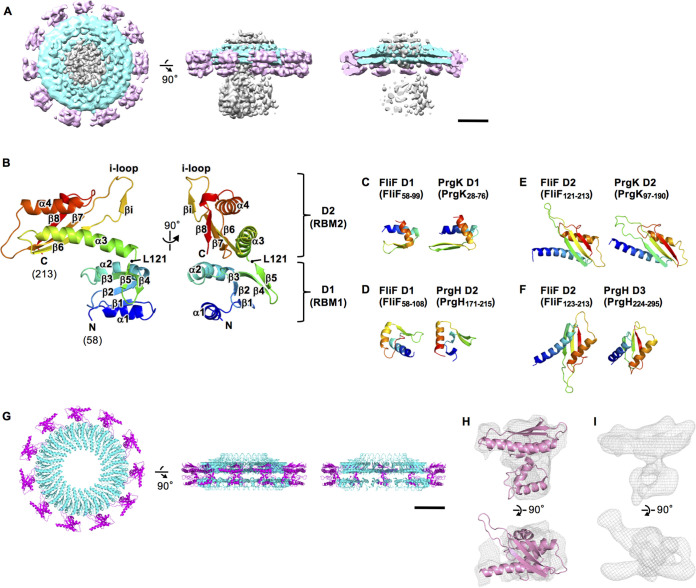
FIG 2.
Structure of RBM1 and RBM2 of FliF. (A) The cryoEM surface map of the inner ring and the middle region of the M-ring with the central blurred density. The top view, the side view, and the vertical section are shown in the left, the middle, and the right, respectively. The scale bar is 50 nm. (B) Cα ribbon drawing of the crystal structure of Aa-FliF58–213. The model is color coded from blue to red from the N to the C terminus. The structure consists of two domains, namely, D1 (residues 58 to 122) and D2 (residues 123 to 213). (C to F) Comparison of the domain structures of Aa-FliF with those of PrgH and PrgK. (G) The structure model of the inner ring (cyan) and the middle region (magenta) of the M-ring. The top view, the side view, and the vertical section are shown in the left, the middle, and the right, respectively. (H) Superimposition of the D1 to D2 structure (pink) on the cryoEM map of the middle region of the M-ring after applying the 11-fold symmetry averaging (gray mesh). (I) 8.6-Å density maps of the middle region calculated from the D1 to D2 structure model.

