FIG 2.
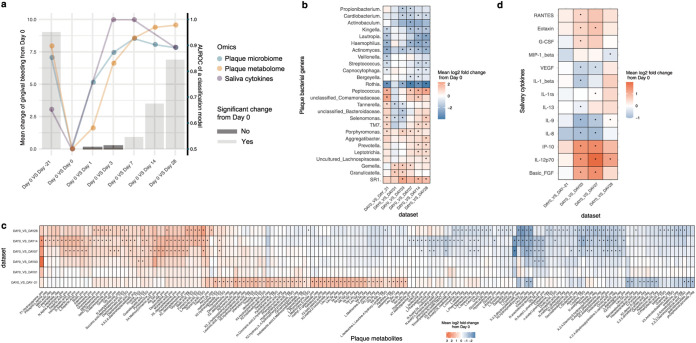
A plaque-microbiome-defined SoH stage that takes place earlier than the emergence of clinical symptoms. (a) The symptomatic change (i.e., mean bleeding difference) within hosts (n = 40), between each of the time points (days −21, 1, 3, 7, 14, and 28) and baseline (day 0). The colors of the bars show FDR-corrected statistical significance; specifically, days 1 to 3 are the SoH stage, when no change in clinical symptoms compared to baseline was observed within the hosts. The scatterplots show the AUROC (the y axis on the right) of classification models using plaque microbiota, plaque metabolome, or salivary cytokines between day 0 and each of the other time points (days −21, 1, 3, 7, 14, and 28). For panels b, c, and d, we identified molecular features from each measurement type that were differentially abundant at a given time point compared to day 0. (b) Heat map for the mean log2 fold change of microbial responders (threshold Bonferroni P < 0.05) in plaque during the onset and progression of NG. (c) Heat map for the mean log2 fold change of both early and persistent metabolite responders (threshold Bonferroni P < 0.05) in plaque. On the x axis, “pos” and “neg” indicate acquisition via positive and negative ionization modes in the nontargeted metabolomic approach, while “TSQ” indicates acquisition from the targeted metabolomic approach. (d) Heat map for the mean log2 fold change of cytokines at each time point (days −21, 3, 7, and 28) versus baseline (day 0). Blue denotes reduction, while red shows enrichment (versus baseline). Bonferroni-corrected statistical significance: *, P ≤ 0.05. The absence of an asterisk indicates no significant change.

