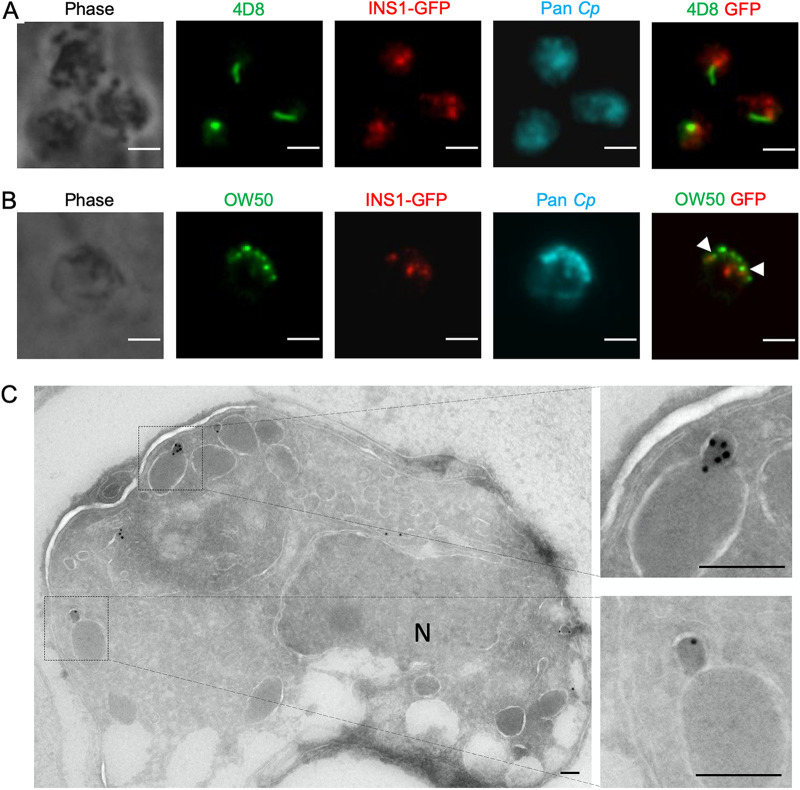
FIG 4.
Expression of INS1 in different life cycle stages of C. parvum. (A) Immunofluorescence staining of macrogamont-specific MAb 4D8 in INS1-GFP parasites. HCT-8 cells were infected with INS1-GFP oocysts. After 48 hpi, coverslips were fixed and stained with mouse MAb 4D8 followed by goat anti-mouse IgM Alexa Fluor 488, rabbit anti-GFP followed by goat anti-rabbit IgG Alexa Fluor 568, rat pan-Cp followed by goat anti-rat IgG Alexa Fluor 647, and Hoechst for nuclear staining. Scale bars, 2 μm. (B) Immunofluorescence staining of OW50 in INS1-GFP parasites. Arrowheads indicate staining of OW50-positive vesicles that were in close proximity to INS1. HCT-8 cells were infected with INS1-GFP oocysts. After 48 hpi, coverslips were fixed and stained with mouse MAb OW50 followed by goat anti-mouse IgG Alexa Fluor 488, rabbit anti-GFP followed by goat anti-rabbit IgG Alexa Fluor 568, rat pan-Cp followed by goat anti-rat IgG Alexa Fluor 647, and Hoechst for nuclear staining. Scale bars, 2 μm. (C) Transmission electron micrographs of macrogamont of INS1-GFP parasites. HCT-8 cells were infected with INS1-GFP oocysts. After 48 hpi, cells were fixed and stained with rabbit anti-GFP followed by 18-nm colloidal gold goat anti-rabbit IgG. Two images on the right are enlarged sections of the image on the left, as indicated by the dotted lines. N, nucleus. Scale bars, 200 nm.

