FIG 6.
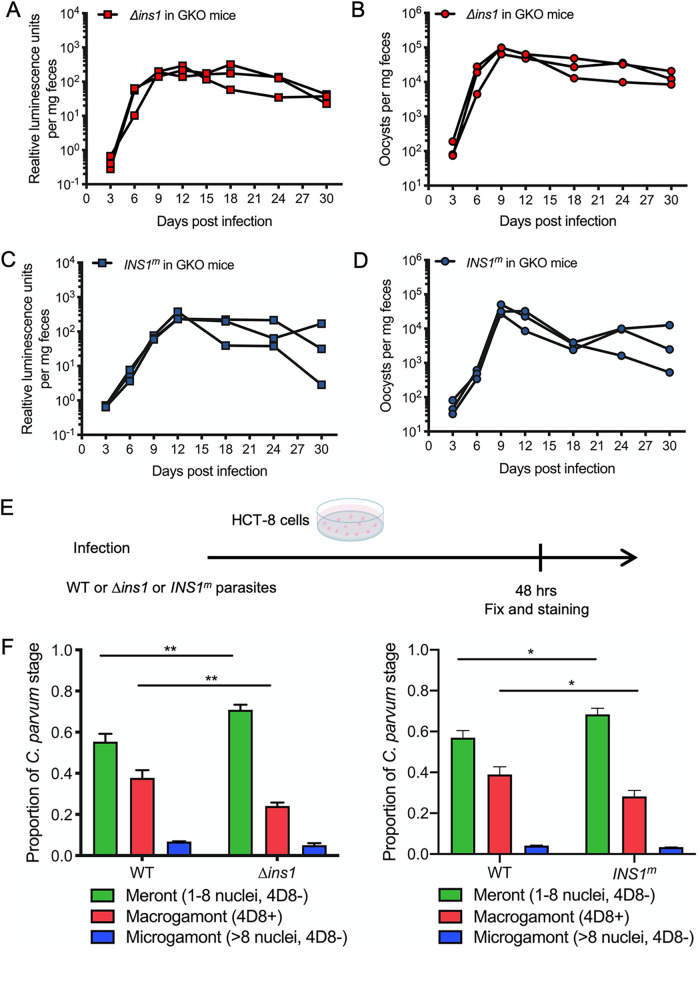
Influence of Δins1 parasites and INS1m parasites on development of C. parvum in vivo and in vitro. (A) Relative luminescence of C. parvum per milligram of feces. Each red box represents a single pellet, and each connecting line represents an individual GKO mouse infected with Δins1 parasites from the second round of amplification. (B) The number of oocysts per milligram of feces was measured by qPCR. Each red dot represents a single pellet, and each connecting line represents an individual GKO mouse infected with Δins1 parasites from the second round of amplification. (C) Relative luminescence of C. parvum per milligram of feces. Each blue box represents a single pellet, and each connecting line represents an individual GKO mouse infected with INS1m parasites from the second round of amplification. (D) The number of oocysts per milligram of feces was measured by qPCR. Each blue dot represents a single pellet, and each connecting line represents an individual GKO mouse infected with INS1m parasites from the second round of amplification. (E) Outline of the experimental protocol to analyze growth of WT or Δins1 or INS1m parasites in HCT-8 cells. C. parvum WT or Δins1 or INS1m parasites were used to infect HCT-8 cells. After 48 hpi, wells were washed, fixed, and labeled with different antibodies. For WT parasites, coverslips were stained with mouse MAb 4D8 that detects macrogamonts followed by goat anti-mouse IgM Alexa Fluor 488, rabbit pan-Cp followed by goat anti-rabbit IgG Alexa Fluor 568, and Hoechst for nuclear staining. For Δins1 parasites, coverslips were stained with mouse 4D8 followed by goat anti-mouse IgM Alexa Fluor 488, rat anti-mCherry followed by goat anti-rat IgG Alexa Fluor 568, rabbit pan-Cp followed by goat anti-rabbit IgG Alexa Fluor 647, and Hoechst for nuclear staining. For INS1m parasites, coverslips were stained with mouse 4D8 followed by goat anti-mouse IgM Alexa Fluor 488, rabbit pan-Cp followed by goat anti-rabbit IgG Alexa Fluor 568, rat anti-HA followed by goat anti-rat IgG Alexa Fluor 647, and Hoechst for nuclear staining. (F) Quantification of life cycle stages of wild-type, Δins1 (left), or INS1m (right) parasites. Meronts were identified by their content of 1 to 8 nuclei; macrogamonts were identified by labeling with MAb 4D8; microgamonts were identified by many small nuclei (∼16 nuclei). Each time point represents the average from three biological replicates. The number of parasites was counted from 50 fields of view with a 100× oil objective. Values are plotted as the means ± SD. Statistical analysis was performed using unpaired Student's t test for two-sample comparison (*, P < 0.05; **, P < 0.01).

