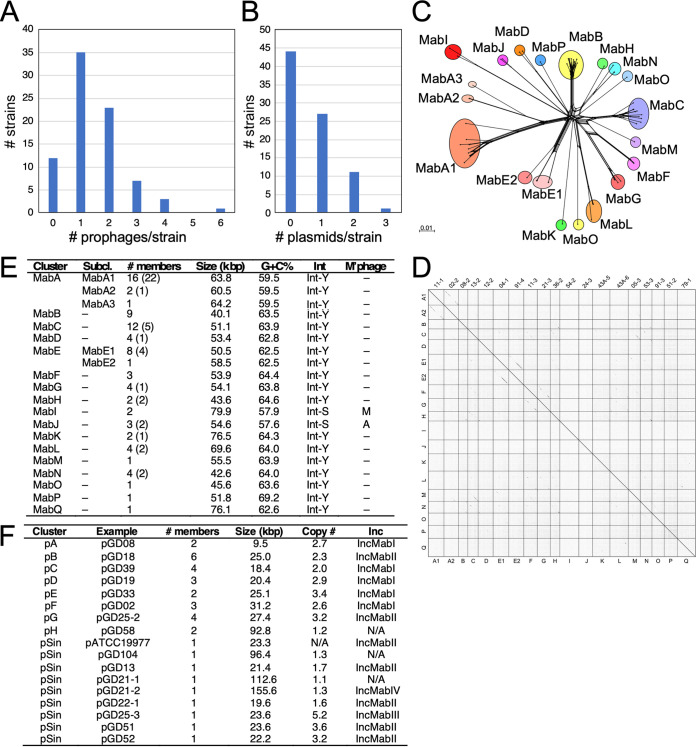
FIG 1.
Diversity of M. abscessus prophages and plasmids. (A and B) Distributions of prophages (A) and plasmids (B) in 82 recent M. abscessus clinical isolates. (C) Phylogenetic network representation of M. abscessus prophages based on shared gene content, as described elsewhere (9, 63). Individual prophages are represented at the nodes, and colored circles indicate groups of phages forming clusters. Scale marker indicates substitutions/site. (D) Dotplot comparison of M. abscessus prophages, comparing one example of each cluster and subcluster, and indicated on both axes. Individual genes are noted at the top. (E) Characteristics of M. abscessus prophages showing the numbers of members in each cluster/subcluster group (the number of additional incomplete prophage sequences are shown in parentheses), average genome size in kbp, average G+C% content, presence of a tyrosine-family (Int-Y) or serine-family (Int-S) integrase, and distantly related mycobacteriophage (M’phage) clusters. (F) Characteristics of M. abscessus plasmids showing examples, the numbers of members in each cluster, average genome size in kbp, average copy number, and the predicted incompatibility (Inc) group.

