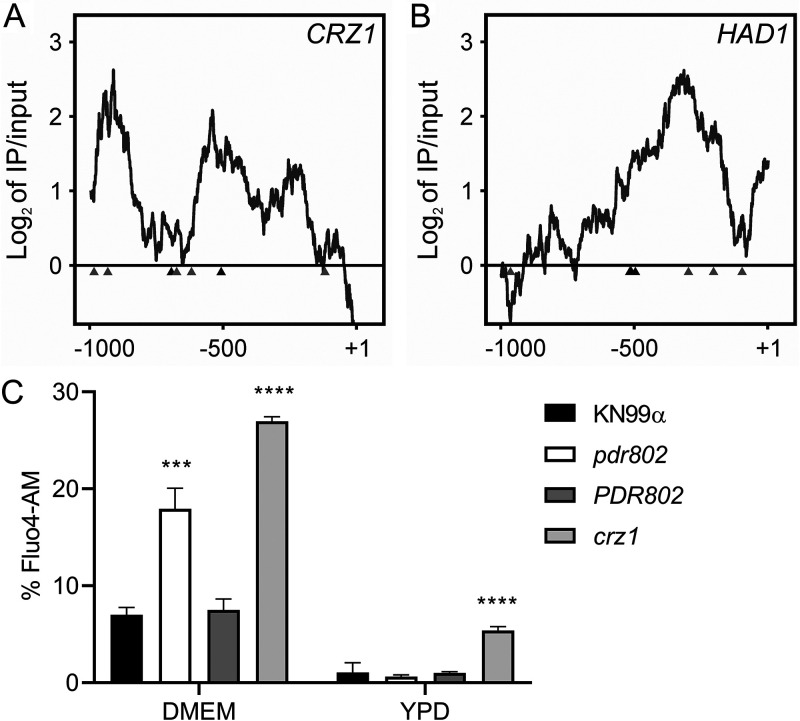
FIG 8.
Pdr802 participates in calcineurin signaling. (A and B) Interactions of Pdr802 with upstream regions of the indicated genes. The ratios (log2) of reads from immunoprecipitated (IP) DNA to input DNA were calculated for 1,000 bp upstream of the first coding nucleotide (+1); shown is the difference in these values between tagged and untagged strains. Black triangles, complete Pdr802 DNA-binding motifs (Fig. S7C); gray triangles, partial motifs. (C) Intracellular calcium measurement by flow cytometry using Fluo-4AM. Each column shows the mean and standard deviation of three biological replicates. ***, P < 0.001, and ****, P < 0.0001, compared to KN99α by one-way ANOVA with a post hoc Dunnett test.

