FIG 3.
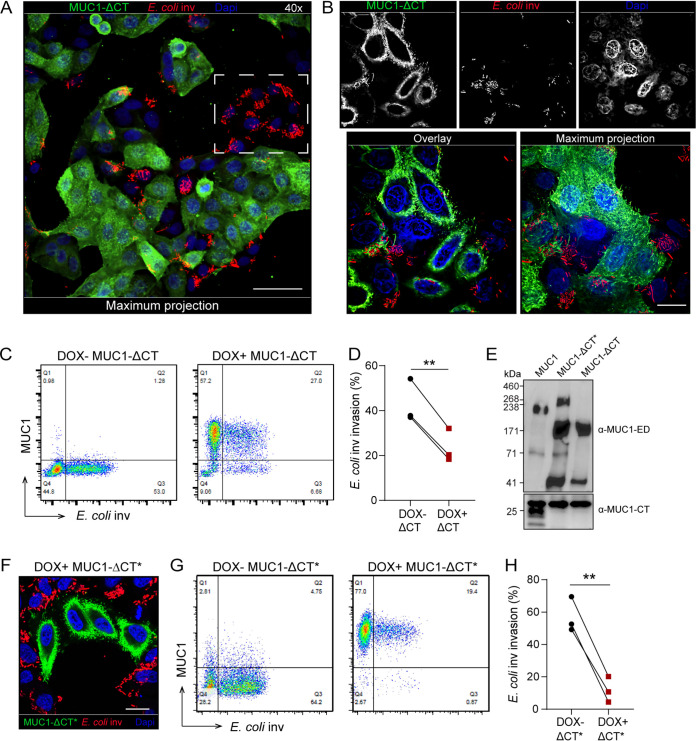
Deletion of the MUC1 cytoplasmic tail reduces E. coli inv invasion. (A and B) Immunofluorescence confocal microscopy of DOX+ ΔCT cells induced with 10 μg/ml doxycycline for 24 h, infected with E. coli inv (mCherry, red) at MOI 40 for 2 h and stained with α-MUC1-ED antibody 139H2 (green) and DAPI to stain the nuclei (blue). White dotted square in (A) denotes infected MUC1-negative cells. Magnification was 40× (A) or 100× (B). (C) Flow cytometry of representative DOX− ΔCT and DOX+ ΔCT cells infected with E. coli inv (GFP) at MOI 20 for 2 h and stained with α-MUC1-ED antibody 139H2. (D) Percentage of E. coli inv (GFP)-infected cells in DOX− ΔCT cells (Q3/Q3+Q4) and DOX+ ΔCT cells (Q2/Q1+Q2) calculated from (C). Each pair of data points represents the result from a single independent experiment. Three independent experimental replicates are shown. Statistical significance was determined by Student’s t test using GraphPad Prism software. *, P < 0.05; **, P < 0.01; ns, not significant. (E) Western blot analysis of DOX+ MUC1, DOX+ MUC1-ΔCT*, and DOX+ MUC1-ΔCT cells detected with α-MUC1-ED antibody 214D4 or α-MUC1-CT antibody F33. (F) Immunofluorescence confocal microscopy of DOX+ ΔCT* cells infected with E. coli inv (mCherry, red) at MOI 40 for 2 h, stained with α-MUC1-ED antibody 139H2 (green) and DAPI to stain the nuclei (blue). (G) Flow cytometry of representative DOX− MUC1-ΔCT* and DOX+ MUC1-ΔCT* cells infected with E. coli inv (GFP) at MOI 20 for 2 h and stained with α-MUC1-ED antibody 139H2. (H) Percentage of E. coli inv (GFP)-infected cells in MUC1-ΔCT* negative cells of DOX− MUC1-ΔCT* cells (Q3/Q3+Q4) and MUC1-ΔCT* positive cells of DOX+ MUC1-ΔCT* cells (Q2/Q1+Q2) calculated from (G). Each pair of data points represents the result from a single independent experiment. Three independent experimental replicates are shown. Statistical significance was determined by Student’s t test using GraphPad Prism software. *, P < 0.05; **, P < 0.01; ns, not significant. White scale bars represent 20 μm.

