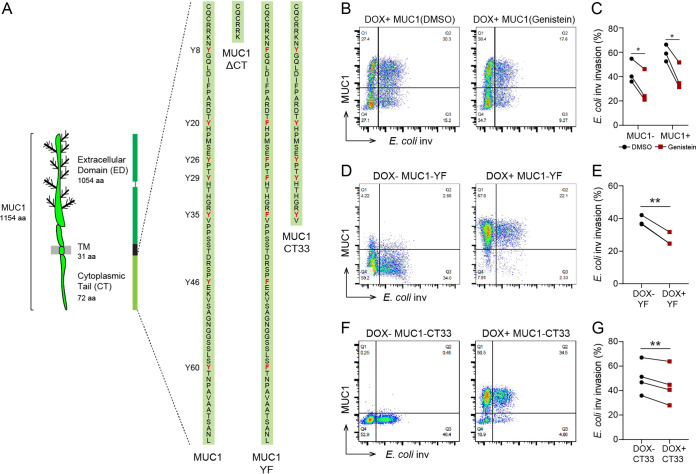
FIG 4.
MUC1 tail attributes are involved in modulating E. coli inv invasion. (A) Schematic model showing the domain structure of MUC1 and the protein sequence of the MUC1 cytoplasmic tail and the tails of the MUC1-ΔCT, MUC1-YF, and MUC1-CT33 constructs. Tyrosines (Y) and substituted phenylalanines (F) are indicated in red. (B) Flow cytometry of representative DOX+ MUC1 cells induced with 10 μg/ml doxycycline for 24 h, treated with 75 μM genistein or DMSO for 30 min before infection with E. coli inv (GFP) and for the duration of the infection assay, and stained with α-MUC1-ED antibody 139H2. (C) Percentage of E. coli inv (GFP)-infected cells treated with genistein or DMSO in subpopulation MUC1− or MUC1+ cells of DOX+ MUC1 cells calculated from (B). (D) Flow cytometry of representative DOX− MUC1-YF or DOX+ MUC1-YF cells infected with E. coli inv (GFP) at MOI 20 for 2 h and stained with α-MUC1-ED antibody 139H2. (E) Percentage of E. coli inv (GFP)-infected cells in DOX− MUC1-YF cells (Q3/Q3+Q4) and DOX+ MUC1-YF cells (Q2/Q1+Q2) calculated from (D). (F) Flow cytometry of representative DOX− MUC1-CT33 and DOX+ MUC1-CT33 cells infected with E. coli inv (GFP) at MOI 20 for 2 h and stained with α-MUC1-ED antibody 139H2. (G) Percentage of E. coli inv (GFP)-infected cells in DOX− MUC1-CT33 cells (Q3/Q3+Q4) and DOX+ MUC1-CT33 cells (Q2/Q1+Q2) calculated from (F). Each pair of data points represents the result from a single independent experiment. Three or four independent experimental replicates are shown. Statistical significance was determined by Student’s t test using GraphPad Prism software. *, P < 0.05; **, P < 0.01; ns, not significant.

