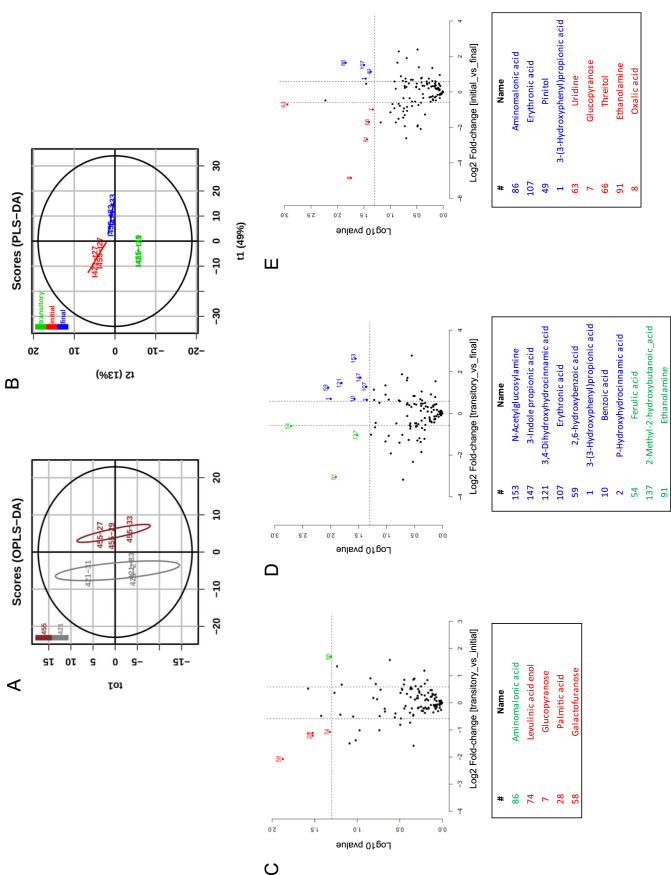
FIG 7.
Metabolomic profiles according to animal (421 and 455) and sampling time. Sampling time was referred to as initial in red (week 27 for both animals), transitory in green (weeks 31 for 421 and week 29 for 455), and final in blue (week 33 for both animals). Variations in metabolomes were visualized by OPLS-DA model score plot for the animal response (A) and by PLS-DA score plot for the time response (B). Discriminant metabolites are presented in volcano plots showing pairwise comparisons between initial versus transitory (C), transitory versus final (D), and initial versus final (E) sampling times. The dashed lines mark the significance thresholds adjusted to a P value of <0.05 and to a log2 fold change of >0.6 or less than −0.6 corresponding to a fold change of >1.5 or less than −1.5. Significant metabolites obtained for each comparison were colored according to sampling time and were given a number for the corresponding metabolite presented in the table below each plot. In the tables, a positive or negative log2 fold change means a higher abundance or lower abundance, respectively, at the sampling time defined by its color. Only the metabolites (= variable) with a variable importance projection (VIP) of >1.0 in the PLS-DA analysis were considered relevant for time discrimination.

