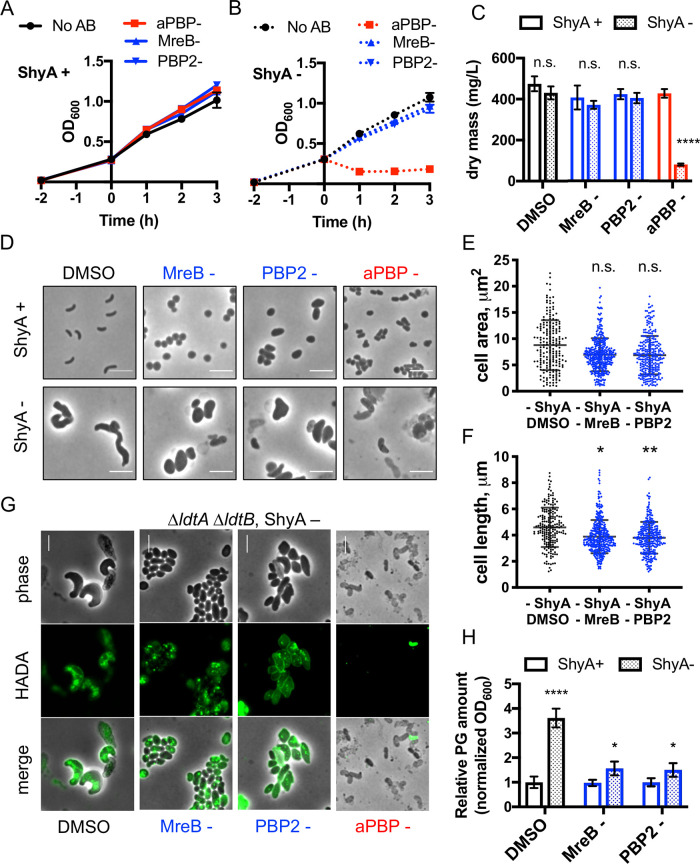
FIG 2.
Cell mass increase and PG incorporation during EP insufficiency relies on aPBP activity. Δ6 endo grown overnight in IPTG (200 μM) was washed twice and diluted 100-fold into fresh medium with inducer (ShyA+) (A) or without inducer (B) (ShyA -) (B). After 2 h of growth, either vehicle (0.1% DMSO, shown in black), the aPBP inhibitor moenomycin (aPBP-, 10 μg ml−1, 8× MIC, shown in red), the MreB inhibitor MP265 (MreB-, 300 μM, 15× MIC, shown in blue), or the PBP2 inhibitor amdinocillin (PBP2-, 10 μg ml−1, 20× MIC, shown in blue) were added. At the indicated time points, OD600 was measured; data are averages of three biological replicates, and error bars represent standard deviations. (C) At 2 h after drug treatment, 120 ml of cells was harvested and dried on a heat block (65°C) until the mass steadied (∼24 h). Dry mass values were transformed into milligrams per liter. Data are averages of three biological replicates, and error bars represent standard deviations. Asterisks denote statistical difference via paired multiple t tests (****, P < 0.0001). n.s., not significant. (D) Representative cell morphologies 2 h after drug addition are shown. (E) Cell area (square micrometers) and (F) cell length (micrometer) were measured in ImageJ. Raw data points are shown. Asterisks denote statistical difference via Kruskal-Wallis test (**, P < 0.01; *, P < 0.05). (G) An overnight culture of the Δ6 endo ΔldtA ΔldtB strain was diluted into medium without inducer. After 2 h of ShyA depletion, HADA (100 μM) was added for another 1 h. Cells were then washed twice and imaged. Antibiotics moenomycin (aPBP -), MP265 (MreB -), and amdinocillin (PBP2 -) were added for 1 h after the 2-h initial depletion, followed by 1-h addition of HADA. All bars, 5 μm. (H) At 2 h after drug treatment, relative PG content of Δ6 endo strain relative to OD600 was measured via UPLC analysis (see Materials and Methods for details). Data are normalized to the ShyA+ DMSO sample. Error bars represent standard deviations of three biological replicates. Asterisks denote statistical difference via unpaired t tests (****, P < 0.0001; *, P < 0.05).

