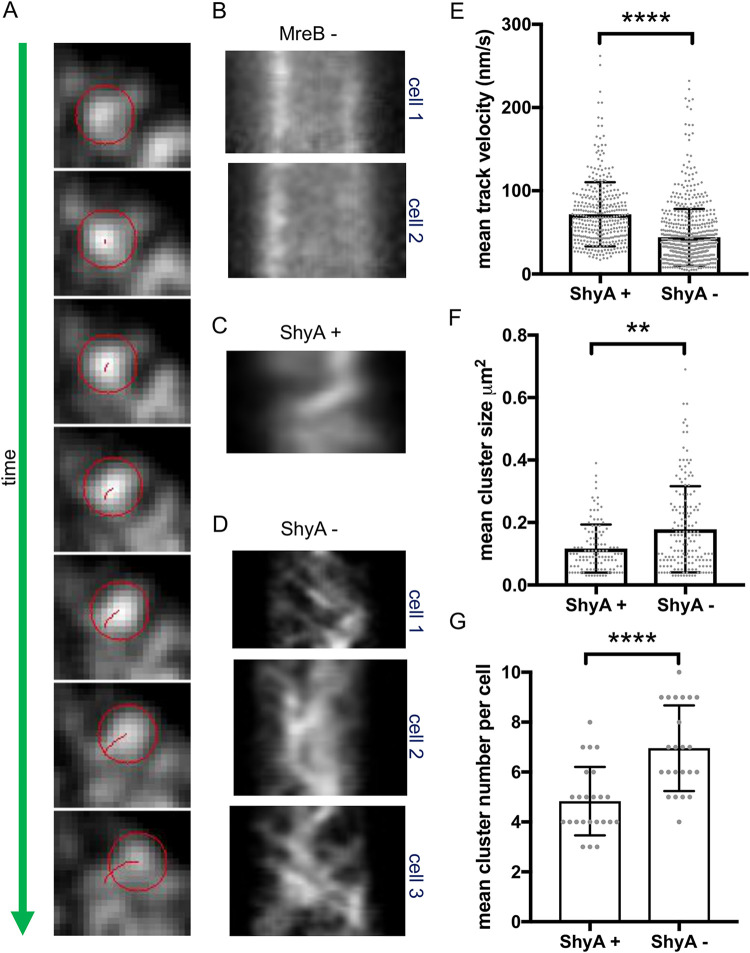
FIG 3.
MreB movement continues during EP insufficiency. Δ6 endo (A to D) or Δ8 endo (E to G) strain expressing an mreBmsfGFPsw fusion from its native chromosomal locus was diluted from an overnight culture grown in the presence of IPTG into growth medium without inducer (ShyA -). After 3 h, cells were imaged using epifluorescence microscopy (A to D) or TIRF (E to G). MreB movement was analyzed using Fiji (TrackMate). (A) A representative single moving MreB focus track (red circle) is shown (frames are 2.5 s apart). (B to D) Representative kymographs of MreB foci are shown for cells grown in the presence of the MreB inhibitor MP265 (MreB -) (B), in the presence of inducer (ShyA +) (C), or in the absence of inducer (ShyA -) (D). (E to G) TIRF was used to assess MreB focus velocity (E), mean cluster size (F), and mean cluster number (G). Raw data points are shown, and error bars represent standard deviations. Asterisks denote statistical difference via Mann-Whitney test (**, P < 0.01; ****, P < 0.0001).

