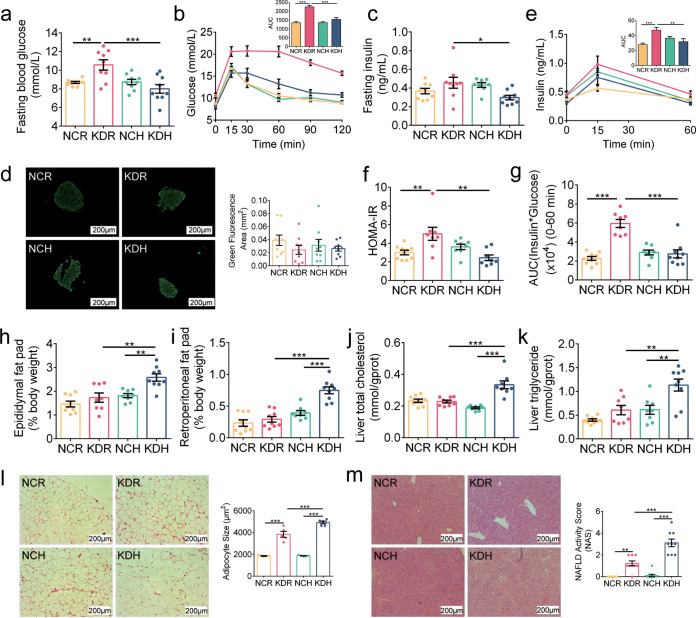
FIG 1.
KD induced glucose intolerance and lipid accumulation in mice. (a) Fasting blood glucose. (b) Curves of blood glucose levels during oral glucose tolerance test (OGTT) and areas under the curve (AUC). (c) Fasting serum insulin. (d) Representative insulin immunofluorescence-stained (green) histological sections of pancreas (scale bar = 200 μm) and calculated mean area of islet. (e) Serum insulin levels during OGTT and AUC. (f) Homeostasis model assessment of insulin resistance (HOMA-IR). (g) Insulin resistance index (the product of the 0- to 60-min AUC of blood glucose and that of serum insulin in OGTT). (h and i) Epididymal and retroperitoneal fat mass (% body weight), respectively. (j and k) Concentrations of total cholesterol and triglyceride in liver, respectively. (l) Representative H&E-stained histological sections of epididymal adipose tissue (eAT) (scale bar = 200 μm) and calculated mean cell area of adipocytes (n = 5 per group). (m) Representative H&E-stained histological sections of liver (scale bar = 200 μm) and calculated histologic score (NAFLD activity score). Data are presented as the mean ± SEM and analyzed using one-way ANOVA, followed by a Tukey post hoc test. *, P < 0.05; **, P < 0.01; ***, P < 0.001. n = 8 to 9 for both groups for all analyses except n = 5 for panel l.

