Fig. 2.

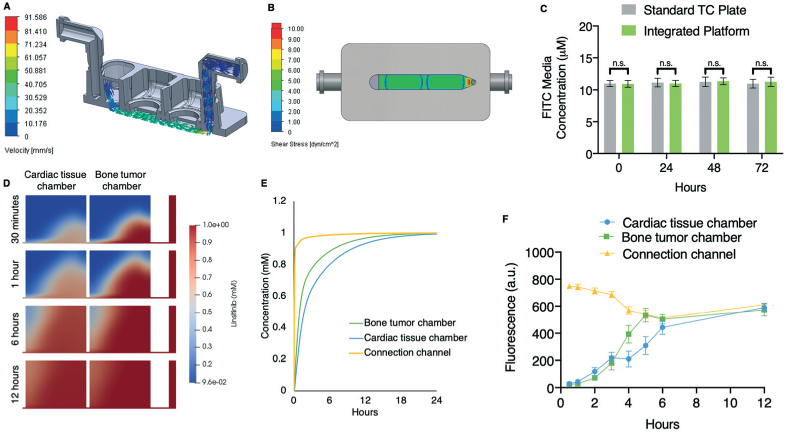
Concentration profiles of a hydrophobic small-molecule tracer and linsitinib circulation within the platform. A. Simulated fluid flow velocity of circulating medium in the platform. B. Simulated shear stress of circulating medium in the platform. C. Hydrophobic FITC (10 μM) was circulated in the platform and its concentration, relative to a control sample in a standard 12-well tissue culture plate, was assessed at 0, 24, 48, and 72 hours (mean ± s.e.m., n = 6). D. Simulated linsitinib concentration gradients within each tissue chamber at 30 minutes and 1, 6, and 12 hours after introduction of linsitinib to the media reservoir. E. Simulated linsitinib concentration in both tissue chambers and in the microfluidic channel over 24 hours. F. Empirical FITC concentrations across both individual tissue chambers and the microfluidic channel were measured every 2 hours for up to 12 hours (mean ± s.e.m., n = 4). *P < 0.05; **P < 0.01; ***P < 0.001 by unpaired, two-tailed Student's t test.
