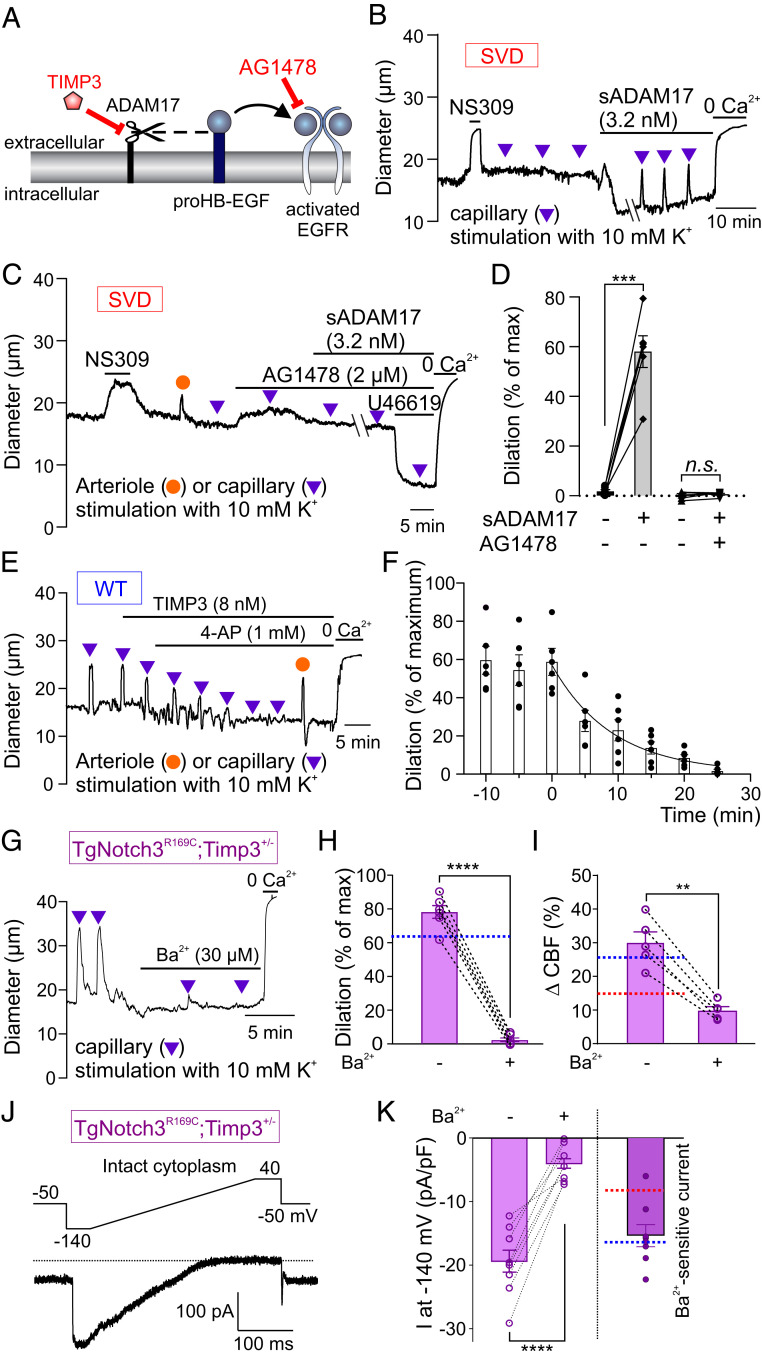
Fig. 3.
Pathogenic accumulation of TIMP3 reduces Kir2.1 currents and K+-induced dilations in SVD. (A) ADAM17/HB-EGF/EGFR signaling axis. TIMP3 inhibits ADAM17-mediated cleavage of proHB-EGF (black dashed line) and subsequent EGFR activation by HB-EGF (black arrow). (B) Arteriole diameter trace in a CaPA preparation from an SVD mouse showing myogenic tone and arteriolar dilation induced by capillary stimulation with 10 mM K+ in the presence of bath-applied sADAM17. (C) Trace showing block of sADAM17 effects by the EGFR antagonist AG1478. (D) Summary data from two groups of six SVD mice showing arteriolar dilation induced by capillary stimulation with 10 mM K+ (n.s., not significant; ***P < 0.001, paired Student’s t test). (E) Arteriole diameter trace showing effects of bath-applied TIMP3 on capillary-to-arteriole electrical signaling in WT CaPA preparation. (F) Summary data for E from six WT animals. (G) Arteriolar diameter trace in a CaPA preparation showing rescue of capillary-to-arteriole electrical signaling by genetic reduction of TIMP3 expression in SVD mice. (H) Summary data from six TgNotch3R169C;Timp3+/− mice showing inhibitory effect of 100 µM Ba2+ on K+ (10 mM)-induced dilation (****P < 0.0001, paired Student’s t test). Dotted blue line indicates dilation observed in a WT CaPA preparation, as in Fig. 1C. (I) Whisker stimulation-induced CBF increases in five TgNotch3R169C;Timp3+/− mice in the absence and presence of 100 µM Ba2+ (**P < 0.01, paired Student’s t test). Dotted lines indicate whisker stimulation–induced CBF changes in SVD (red) and WT (blue) mice in the absence of Ba2+, as in Fig. 2C. (J) Ba2+-sensitive Kir2.1 current in a TgNotch3R169C;Timp3+/− cEC, recorded in the perforated patch-clamp configuration. (K) Summary data showing currents recorded from TgNotch3R169C;Timp3+/− cECs in the absence and presence of 100 µM Ba2+ (n = 8 cECs from two mice; ****P < 0.0001, paired Student’s t test). (Right) Ba2+-sensitive Kir2.1 current. Dotted lines indicate current density observed in SVD (red) and WT (blue) cECs as in Fig. 2E.

