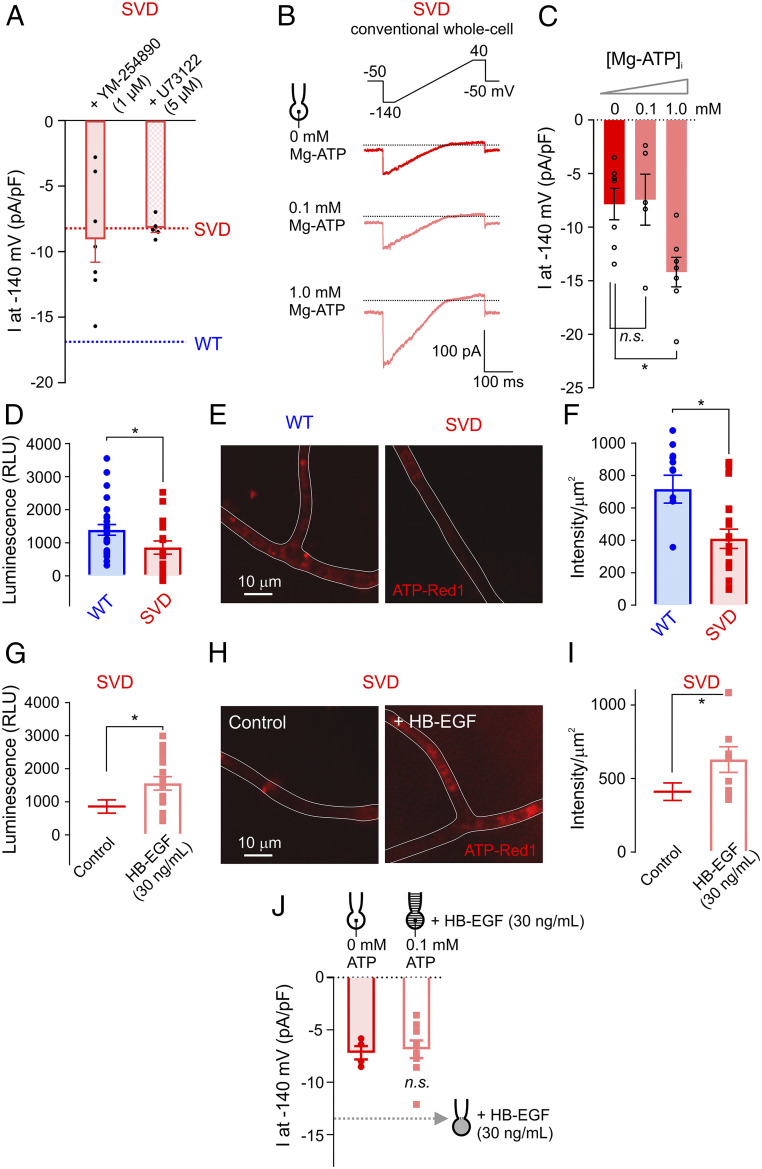
Fig. 6.
Decreased intracellular ATP in capillaries from SVD mice. (A) Summary data for Kir2.1 currents in cECs from SVD mice measured using the perforated-patch configuration. SVD cECs were bath-incubated for ∼15 min with the Gαq/11 inhibitor YM-254890 or the phospholipase C inhibitor U73122 (n = 5–7 cECs from three to four mice per group). Dotted lines indicate current density observed in SVD (red) and WT (blue) cECs, as in Fig. 2E. (B) Kir2.1 currents in SVD cECs dialyzed with 0, 0.1, or 1 mM Mg-ATP in the pipette solution using the conventional configuration. (C) Summary data for B (n = 5–7 cECs from four mice; n.s., not significant, *P < 0.05, one-way ANOVA). (D–I) Intracellular ATP levels in WT or SVD cECs, without or with HB-EGF treatment. cEC luminescence (in relative luminescence units [RLU]), reflecting luciferase-induced conversion of ATP to light, is directly proportional to cEC ATP concentration (D and G). cEC fluorescence intensity, measured with the live cell ATP dye ATP-Red1, is proportional to ATP levels (E, F, H, and I). Each data point on scatter plots in F and I represent a capillary segment, and each data point in D and G was obtained using ∼500 cECs manually collected from three WT and three SVD mice (*P < 0.05, unpaired Student’s t test). (J) Kir2.1 currents in cECs from SVD, recorded using the conventional configuration. One group of cECs was dialyzed with 0 mM Mg-ATP, and the other was dialyzed with 0.1 mM Mg-ATP and incubated with HB-EGF for ∼20 min (n = 4–9 cECs from six mice; n.s., not significant, unpaired Student’s t test). Dotted line indicates Kir2.1 current amplitude in SVD cECs incubated with HB-EGF using the perforated configuration (as in Fig. 4F).

