Fig. 1.
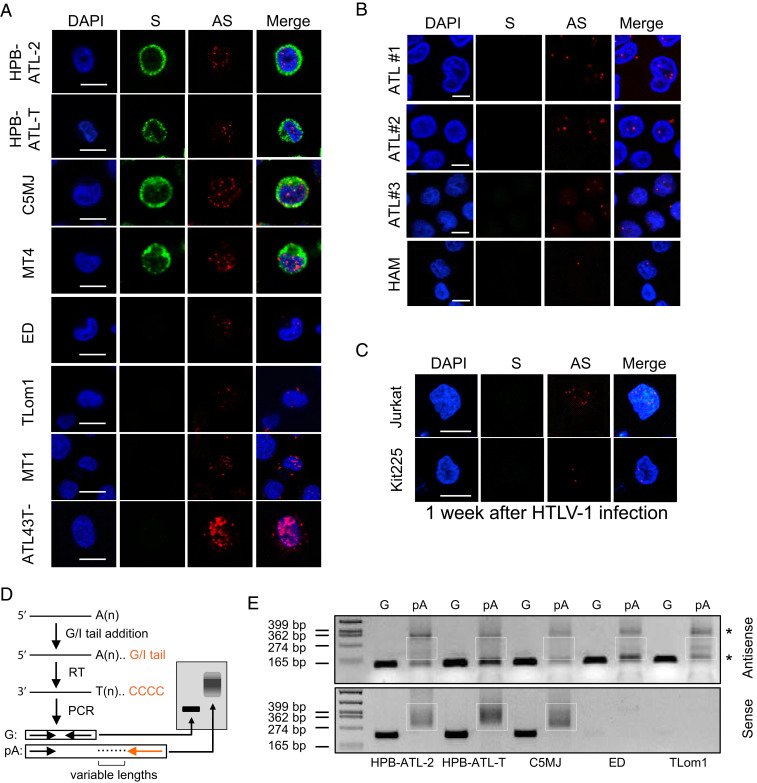
HBZ mRNA is predominantly localized in the nucleus and inefficiently polyadenylated. (A) Representative RNA-FISH results of HTLV-1–infected T cell lines showing nuclear localization of the HTLV-1 antisense (AS) mRNA HBZ (red) and cytoplasmic localization of HTLV-1 sense (S) mRNAs (green) (scale bar, 10 μm). (B) Representative RNA-FISH results of primary cells from HTLV-1–infected patients with ATL or HAM (scale bar, 5 μm). (C) Representative RNA-FISH results of Jurkat or Kit225 cells de novo infected with HTLV-1 (scale bar, 10 μm). (D) Illustration of how the poly (A) tail assay works. The assay first adds a G/I tail to mRNAs. Then, reverse transcription is performed using a universal reverse primer so that all complementary DNA will have a common 5′ end. Finally, two PCRs are performed; the first one amplifies a gene-specific product using a forward primer located at 100 to 200 bp upstream of the RNA cleavage site and a reverse primer located right before the cleavage site, and the second one amplifies a poly (A)-specific product (pA) using the same forward primer and the universal reverse primer. After electrophoresis, the G product will appear as a band while the pA product will appear as a bigger smear. (E) pA tail assay results of three Tax-positive (HPB-ATL-2, HPB-ATL-T, and C5MJ) and two Tax-negative (ED and TLom1) HTLV-1–infected cell lines indicate efficient polyadenylation of sense mRNAs, shown by smears at the Bottom. In contrast, antisense mRNA HBZ only demonstrated faint smears with some nonspecific products (*) (confirmed by sequencing). Smears indicating pA products are marked by white boxes. The assay was preoptimized as shown in SI Appendix, Fig. S3B in order to obtain equivalent amounts of gene-specific products for HTLV-1 antisense and sense mRNAs.

