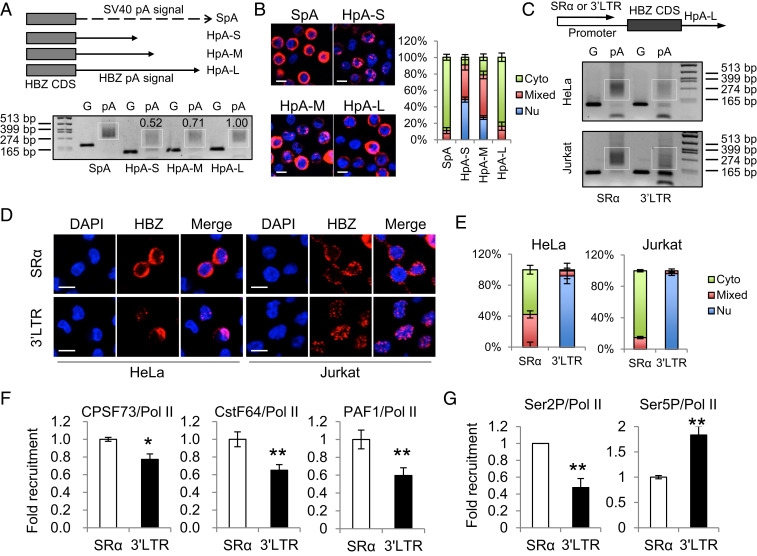
Fig. 2.
The native promoter of the HBZ gene, the HTLV-1 3′ LTR, is likely responsible for the inefficient polyadenylation and nuclear retention of HBZ RNA. (A) The Top illustrates HBZ-expression vectors with modified polyadenylation signals from the HBZ gene. SpA is the positive control SV40 pA signal. HpA is cloned from the native HBZ pA signal. HpA-S ends at the cleavage site of HpA, HpA-M ends at the G/T-rich region, and HpA-L ends 100 bp downstream the AATAAA sequence of HpA. See SI Appendix, Fig. S4A for more details. We expressed these vectors in HeLa cells and performed a pA tail assay, the result of which is shown (Lower). Smears indicating pA products are marked by white boxes and the numerals above the white boxes indicate the relative polyadenylation based on densitometry analysis by ImageJ. The optimization of the pA tail assay is shown in SI Appendix, Fig. S4B. (B) RNA-FISH was performed using HeLa cells expressing the above vectors to localize HBZ RNA (red). The percentage of cells with predominantly cytoplasmic, nuclear, or mixed localization patterns of HBZ RNA was counted using ImageJ and is shown on the Right (scale bar, 10 μm). (C–G) HBZ RNA–expressing vectors using either SR-α or the HTLV-1 3′ LTR as the promoter were transfected into HeLa or Jurkat cells. After 24 h, we performed a pA tail assay (C), RNA-FISH (D), and a chromatin immunoprecipitation (ChIP) assay (F and G). (C) The pA tail assay indicates significantly less smear products when HTLV-1 3′ LTR was the promoter. Smears indicating pA products are marked by white boxes. The optimization of the pA tail assay is shown in SI Appendix, Fig. S4C. (D) RNA-FISH suggests the use of HTLV-1 3′ LTR as the promoter caused nuclear retention of HBZ RNA (scale bar, 10 μm). (E) The percentage of cells with predominantly cytoplasmic, nuclear, or mixed localization patterns of HBZ RNA is shown. (F) A ChIP assay shows reduced recruitment of CPSF73, CstF64, and PAF1 to the HBZ coding sequence when HTLV-1 3′ LTR is used as the promoter. All ChIP results were normalized to the result of nonphosphorylated RNA Pol II. (G) A ChIP assay shows reduced recruitment of Ser2P Pol II, but not Ser5P Pol II, when HTLV-1 3′ LTR is used as the promoter. The statistical analyses were performed by Student’s t test. *P < 0.05; **P < 0.01.

