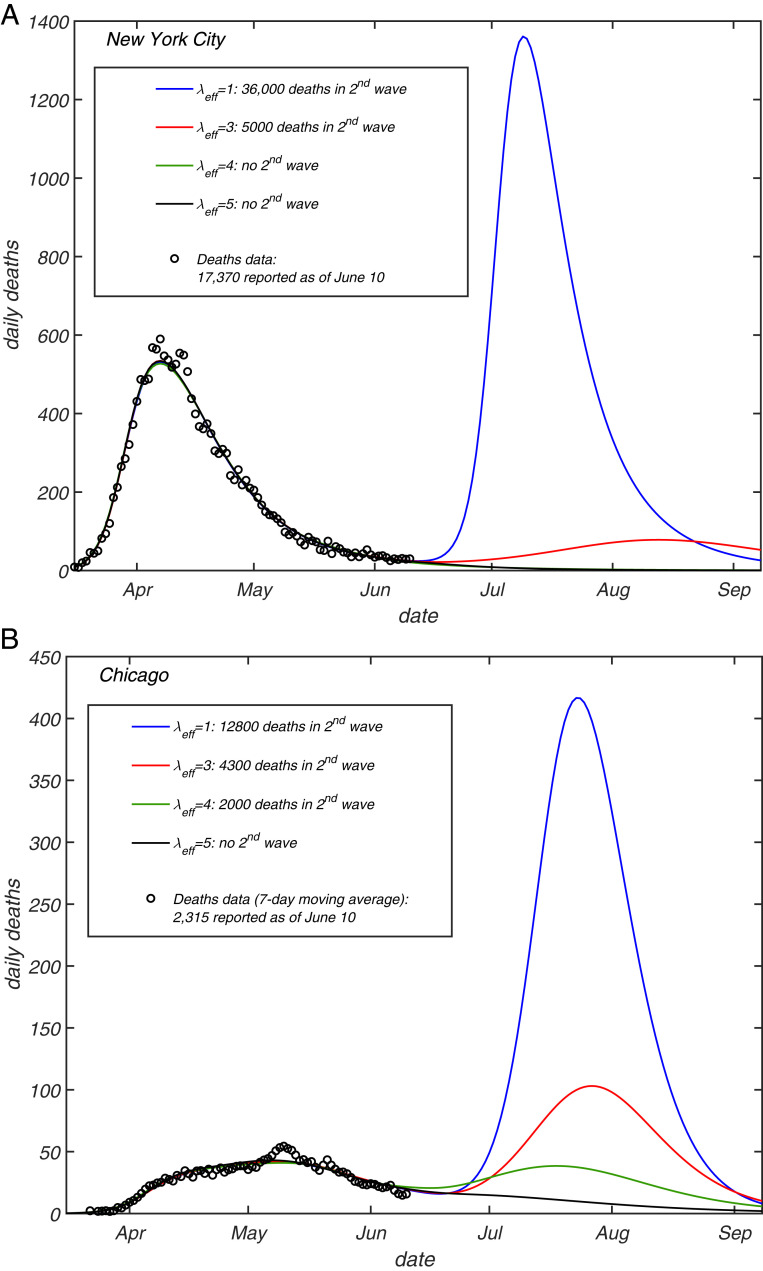
Fig. 4.
Projections of daily deaths under the hypothetical scenario in which any mitigation is completely eliminated as of June 15, 2020, for (A) NYC and (B) Chicago. Different curves correspond to different values of the transient immunity factor (blue), 3 (red), 4 (green), and 5 (black lines). The model described in ref. 43 was fully calibrated on daily deaths (circles), ICU occupancy, and hospitalization data up to the end of May. See SI Appendix for additional details, including CIs.

