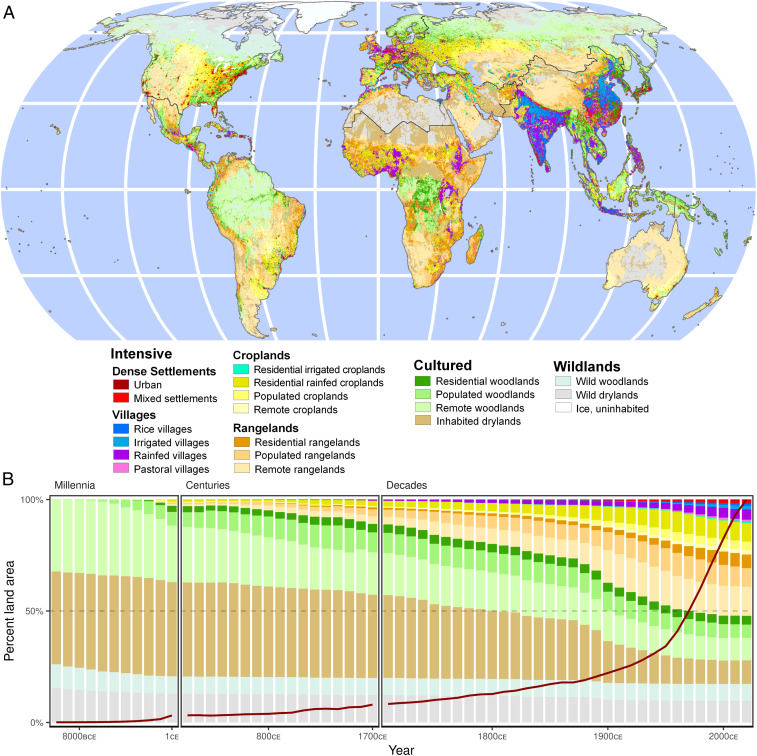
Fig. 1.
Global changes in anthromes and populations 10,000 BCE to 2017 CE. (A) Anthrome map at 2017 CE (Eckert IV projection). (B) Global changes in anthrome areas, with population changes indicated by red line. Anthromes are classified using population densities and dominant intensive land use. Wildlands are defined by zero population and no intensive land use (urban + crops + grazing), Cultured anthromes have low populations and <20% intensive use, and Intensive anthromes are ≥20% intensive. Cultured and Intensive anthromes are further stratified by population densities, in persons km−2, as Remote (>0 to <1), Populated (1 to <10), Residential (10 to <100), Inhabited (>0 to <100), Villages and Mixed settlements (100 to <2,500), and Urban ( ≥2,500). Intensive anthromes are further stratified based on their dominant intensive land use area ≥20% in order of most intensive use (urban > rice > irrigated > cropped > pastured). Woodlands combine all forest and woodland biomes (73); drylands comprise the remaining biomes, from savanna to tundra, excluding permanent ice. Global uncertainties in SI Appendix, Fig. S1.

