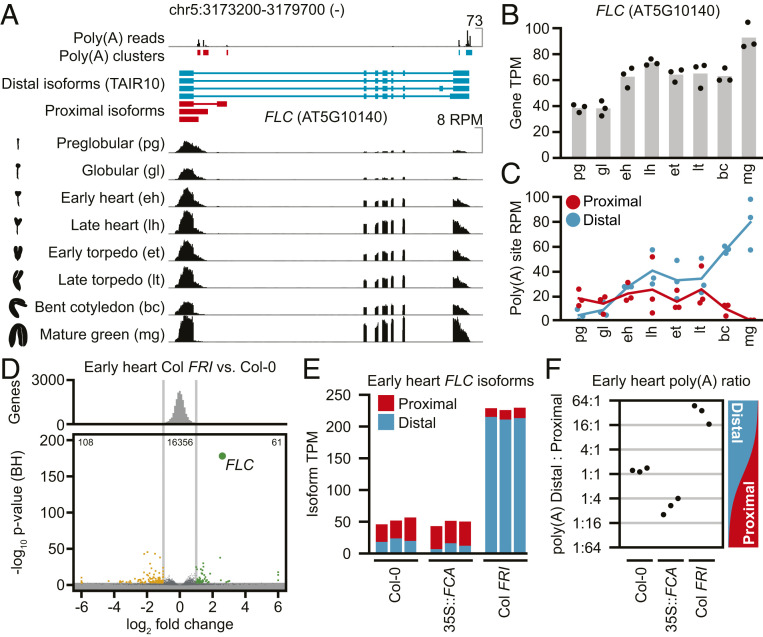
Fig. 1.
FLC polyadenylation site usage changes during embryo development. (A, Top) Distribution of reads with untemplated 3′-terminal poly(A) sequences across eight timepoints of embryo development and grouped into clusters. (A, Middle) Transcript models corresponding to full-length (distal) FLC and proximally polyadenylated (proximal) FLC. (A, Bottom) Mean RNA-seq read coverage at FLC from three biological replicates at eight embryo stages. (B) Mean transcripts per million (TPM) of FLC across the embryonic time series. (C) Poly(A) reads per million (RPM) contained in proximal and distal poly(A) clusters, respectively. (D) Differential gene expression between Col FRI and Col-0 embryos; genes more than twofold significantly higher (green) or lower (orange) in Col FRI embryos are marked (adjusted P value <10−3, DEseq2). (E) Estimated abundance of proximal and distal FLC isoforms in three biological replicates of Col-0, 35S::FCA, and Col FRI early heart embryos. (F) Distal:proximal poly(A) ratio in the same samples as in E, calculated as log2[proximal poly(A) RPM/distal poly(A) RPM].

